As part of the international assessment and review process under the Convention, developed country Parties prepare a report every two years. These biennial reports (BRs) highlight the developed country Parties’ progress in meeting their 2020 targets under the Convention and their provision of financial, technology and capacity-building support to developing country Parties. The reports also showcase the innovative climate actions and institutional frameworks developed country Parties are putting in place to serve as a launch pad for success under the Paris Agreement in the post-2020 period.
COP 17 decided that developed country Parties should submit their BRs two years after the due date of a full national communication. BR5s were due for submission by 31 December 2022. COP 17 also decided that developed country Parties should use the “UNFCCC biennial reporting guidelines for developed country Parties” for preparing their BRs. The latest report (FCCC/SBI/2023/INF.7/Add.1) compiles and synthesizes information from the fifth biennial reports submitted to the secretariat by Parties included in Annex I to the Convention relating to implementation of the Convention, comprising information on quantified economy-wide emission reduction targets for 2020 and achievement of those targets, including mitigation actions and their effects, estimates of emissions and removals, the use of units from market-based mechanisms and the contribution of land use, land-use change and forestry activities; greenhouse gas emission trends and projections; and the provision of financial, technological and capacity-building support to developing country Parties. The following are the key messages from the executive summary.
Australia, Belarus, the EU and its member States, Iceland, Japan, Liechtenstein, Monaco, New Zealand, Norway, the Russian Federation, Switzerland and the United States of America demonstrated achievement of their 2020 targets. Canada did not fully achieve its target for 2020 owing to the time lag between developing and implementing new climate-related policies, regulations and initiatives and seeing the resulting impacts on GHG emissions, while Kazakhstan, though managing to reduce its emissions by 11.1 per cent between 1990 and 2020, fell short of its target of 15 per cent for 2020.
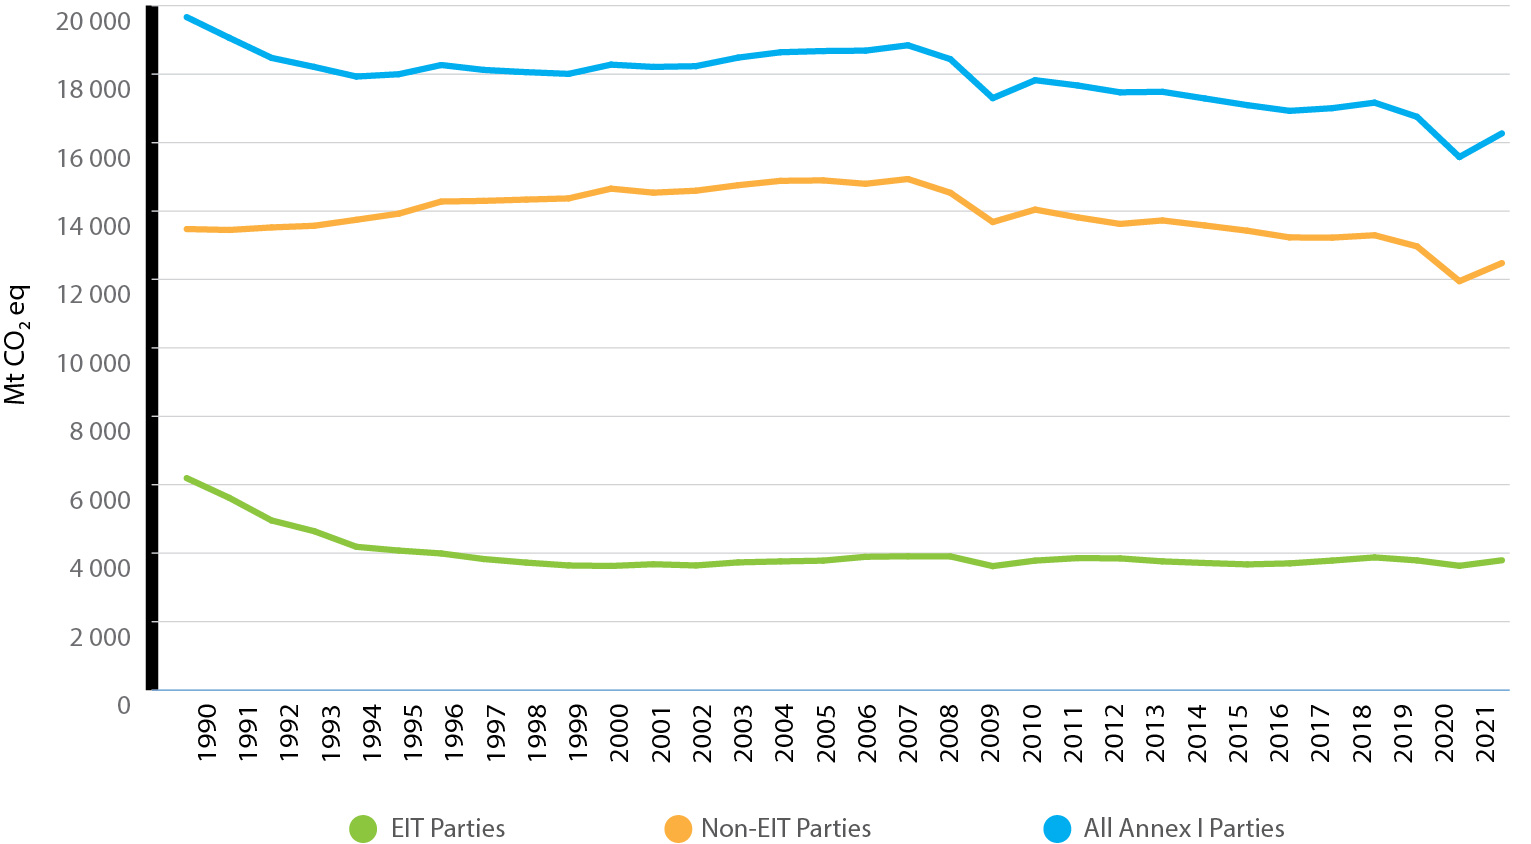
The overall decline in GHG emissions since 1990 primarily reflects the impact of the economic transformation of EIT Parties in the 1990s and the strengthening of climate change mitigation actions by almost all Parties in the second half of the 2000s and after 2010. These actions include promoting the use of less carbon-intensive fuels and of renewable energy in the electricity mix and improving energy end-use efficiency in the energy sector, as well as PaMs in the agriculture and waste sectors. Those measures have been accompanied by modernizing and enhancing the efficiency of industrial processes and reducing the livestock population. The coronavirus disease 2019 pandemic resulted in a 7.0 per cent decrease in emissions in 2019–2020, which was followed by a 4.4 per cent increase in emissions between 2020 and 2021, though emissions in 2021 still remained lower, by about 2.9 per cent, than the pre-pandemic level.
Greenhouse gas emissions without land use, land-use change and forestry of Annex I Parties in 1990–2021
In their BR5s, Parties reported PaMs aimed at increasing renewable energy use for electricity generation, phasing out coal, curbing methane emissions across sectors and promoting electrification in infrastructure and transportation. To support long-term climate action, research and development efforts are focused on advancing new technologies (e.g. carbon capture, utilization and storage), exploring innovative applications for existing technologies (e.g. renewable energy based hydrogen production) and enhancing CO2 removals in the LULUCF sector. Many Parties reported long-term goals and targets (e.g. carbon neutrality or net zero emissions by 2050), and many PaMs (over 40 per cent) had a starting year of 2020 onward – most of these are already in the development phase.
In the BR5s, many Parties linked their climate policies with economic recovery packages developed in response to the socioeconomic impacts caused by the pandemic with a view to generating job opportunities, stimulating economic growth and concurrently addressing GHG emissions and their impacts. This resulted in investments in renewable energy, energy efficiency, clean transportation and sustainable infrastructure; climate-related conditional funding for economies, industries and sectors severely impacted by the pandemic; and investments in initiatives aimed at enhancing adaptation to climate change impacts.
Number and shares of policies and measures reported in biennial reports, by status
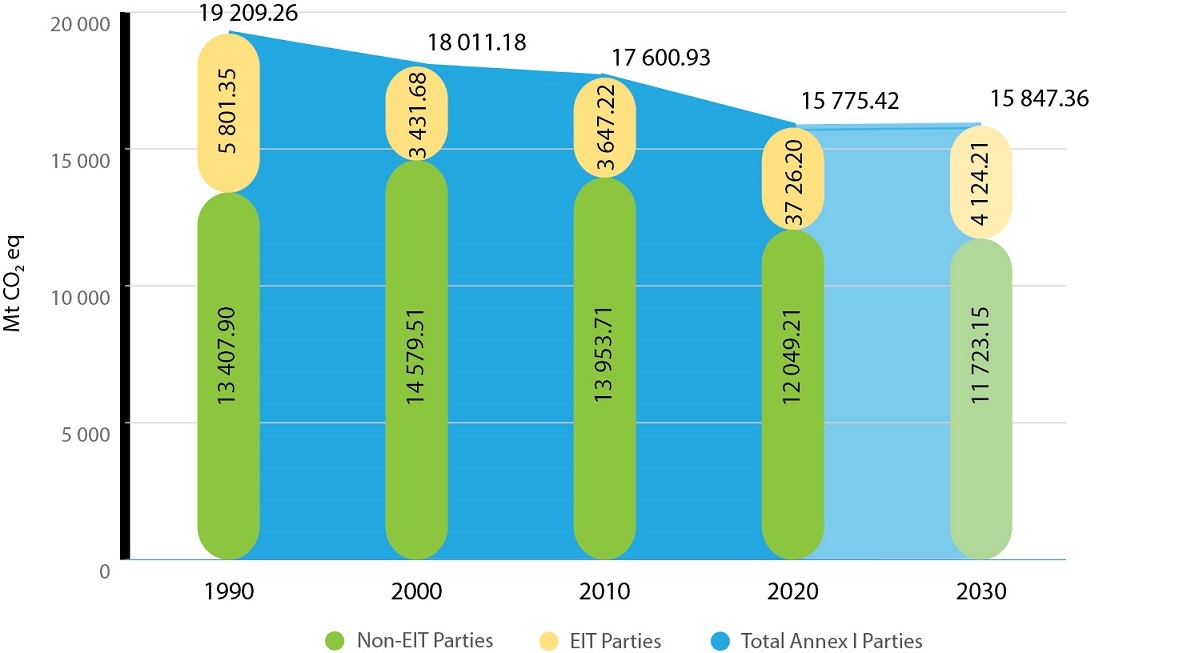
Information on estimated impacts was not reported for most PaMs for 2030 or a longer-term horizon, making it difficult to assess the overall impact of the reported PaMs. Despite enhanced PaMs reported for 2020 onward, total emissions are projected to increase by 0.5 per cent between 2020 and 2030, suggesting the actions are not sufficient to completely offset the impact of emission drivers or reduce emissions in line with the pathways in the AR6 for achieving the goals of the Paris Agreement. This may also suggest, however, that the impacts of post-2020 mitigation actions for which supporting legislation or regulations have yet to be finalized are not yet known and therefore not fully taken into account.
Historical and projected greenhouse gas emissions of Annex I Parties, without land use, land-use change and forestry, under the ‘with measures’ scenario
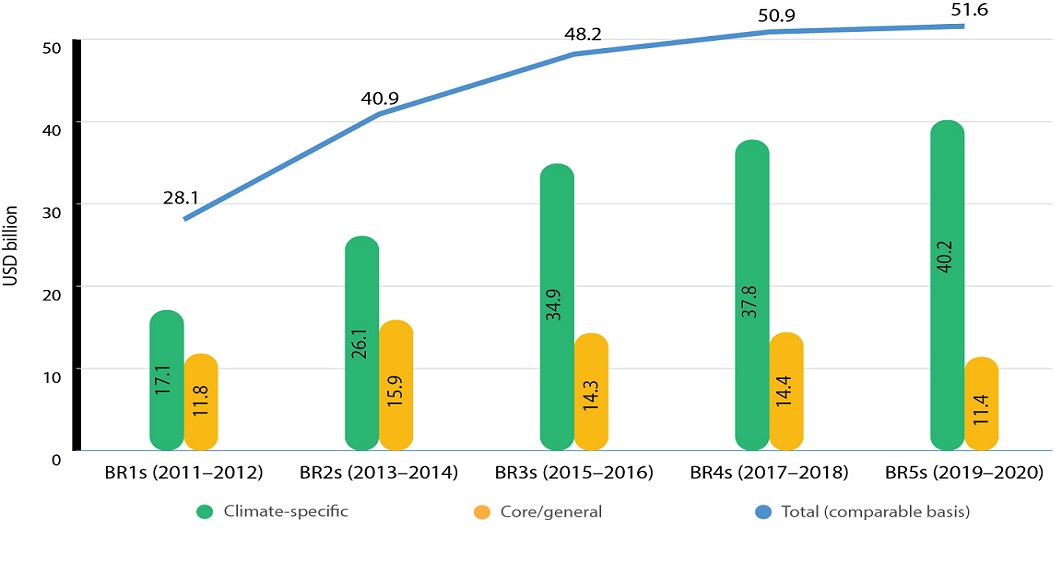
Total climate finance provided by Annex I Parties to developing countries (on a comparable basis) has increased continuously since 2011, albeit the steady and substantial increase observed until 2016 began to slow down thereafter, with increases of only 5.7 and 1.4 per cent observed in the 2017–2018 and 2019–2020 bienniums respectively. Climatespecific support, which was reported in the BR5s to represent more than three quarters of the total support, grew by 6.3 per cent between 2017–2018 and 2019–2020, demonstrating Parties’ commitment to dedicating financial support to climate-specific purposes. In 2019– 2020, more than two thirds of climate finance was provided through bilateral, regional or other channels. Although the largest share of climate-specific finance provided through bilateral channels reported in the BR5s was allocated to mitigation (56.4 per cent), a strong focus on adaptation remained, with many Parties dedicating more support for adaptation than for mitigation.
The BR5s demonstrate Parties’ improvement in reporting on the mobilization of private finance. Following the trend observed in the BR4s, Parties are increasingly tracking and improving reporting on climate-related private sector financial contributions. In their BR5s, they highlighted the importance of using public funding to de-risk and attract investment from private sources. Parties reported different approaches to promoting the scaling up of private investment, such as mobilizing capital through various instruments, employing micro- and co-financing, blending concessional finance with commercial resources and using risk-sharing and insurance mechanisms.
Total climate finance contributions (annual average on a comparable basis), including climate specific and core/general support, in 2011–2020, reported in biennial reports
In their BR5s, Parties reported 430 activities relating to technological support (compared with 425 activities in the BR4s), with activities supporting mitigation accounting for 44 per cent of total activities (compared with 56 per cent in the BR4s), and activities supporting adaptation and cross-cutting action accounting for 32 and 24 per cent respectively (compared with 26 and 18 per cent respectively in the BR4s). Within these areas, deploying and transferring mature climate technologies remained the predominant supported activity, accounting for 60 per cent of supported activities in the BR5s compared with 45 per cent in the BR4s, while support for research and development increased significantly, accounting for 24 per cent of supported activities in the BR5s compared with 14 per cent in the BR4s. The Asia-Pacific region continued to benefit most from the reported technological support, with 36 per cent of all reported technological support activities focusing on that region (down from 43 per cent in the BR4s), followed by Africa (28 per cent, up from 26 per cent in the BR4s) and Latin America and the Caribbean (10 per cent, down from 13 per cent in the BR4s).
Geographical distribution of technology development and transfer activities reported by Annex II Parties in their biennial report
In the BR5s, 732 capacity-building activities were reported, a slight increase (4 per cent) on the 702 activities reported in the BR4s. Continuing the trend observed from the BR3s and BR4s, the most significant share of capacity-building was for adaptation (41 per cent) and this support was mostly focused on making existing and new infrastructure climate resilient and on promoting green transformation in agriculture and forestry. A total of 31 per cent of capacity-building activities covered multiple areas and they primarily took the form of climate partnership programmes. Mitigation accounted for 28 per cent of capacity-building activities, primarily aimed at improving access to renewable energy. Geographically, the majority of the capacity building support for adaptation was provided to the Asia-Pacific and Africa regions. Mitigation support was primarily provided for multiregional or global projects. Emerging or new areas of support included improving documentation and compilation systems for compliance with the ETF.
Number of capacity-building support projects reported in biennial reports, by region