2026 Synthesis Report of Biennial Transparency Reports


The 2026 synthesis report of biennial transparency reports (BTRs) gives an early picture of how Parties are implementing the Paris Agreement across mitigation, adaptation and support. It offers initial insights into national efforts, including successes to build on and barriers to overcome.  

Transparency is at the core of the Paris Agreement. It builds mutual trust and enables ambitious climate action and support. The Enhanced Transparency Framework (ETF) helps Parties build a strong evidence base for climate policymaking and for identifying investment needs and opportunities. By tracking progress in implementing and achieving nationally determined contributions (NDCs), the ETF also promotes effective implementation and fosters accountability and trust among Parties. Together with NDCs and the global stocktake, it forms the foundation for enhancing global ambition in climate action and support under the Paris Agreement over time.

The submission of 137 first BTRs (BTR1s) by 30 September 2026 is a milestone for ETF implementation. BTRs underpin enhanced global reporting on GHG emission trends and projections, mitigation, adaptation, loss and damage and support provided, needed and received. Many Parties also reported on broader aspects of climate action, including just transition, gender, youth and the involvement of non-Party stakeholders. The reports also shed light on Parties’ national circumstances, institutional arrangements and capacities for reporting.

Content of the report

BTR synthesis reports are prepared in response to the request from the Conference of the Parties serving as the meeting of the Parties to the Paris Agreement (CMA) at its first session for the secretariat to produce synthesis reports on BTRs and national inventory reports (NIRs) (decision 18/CMA.1, para. 6(a)).

The 2026 BTR synthesis report builds on the 2025 BTR synthesis report and refreshes the data presented on this webpage. It includes the more than 30 additional submissions received since the cut-off date of the previous synthesis (15 April 2025), and the findings, figures and tables in each chapter have been updated accordingly. The 2025 synthesis report synthesized information from 101 BTR1s and other components of BTR submissions (i.e. national inventory documents (NID), common reporting tables (CRTs) and common tabular format (CTF) tables). No standalone report will be issued for the 2026 update; the synthesis is available on this webpage. This update synthesizes information from the 137 BTR1s and from the NIDs, CRTs and CTF tables submitted by Parties as at 30 September 2026. The submissions contain information and data up to 2022 and together represent some 85 per cent of global GHG emissions in 2020. As at 30 September 2026, 138 Parties had submitted at least one component considered in the synthesis. Of these, 104 submitted NIDs, 122 CRTs, 117 CTFs for NDC information and 92 CTFs for financial, technology development and transfer, and capacity-building support information.[1] The set of Parties covered varies by chapter because reporting requirements and the information provided differ across thematic areas.

The report gives an overview of the information in the BTR1s. Its structure follows the outline of BTRs in annex IV to decision 5/CMA.3. Information is synthesized for all represented Parties taken together.


[1] The 2026 BTR synthesis report includes information from the BTR1 of the United States of America, as presented in the 2025 BTR synthesis report. The synthesis report is a backwards-looking account of implementation, and its greenhouse gas emission data run to 2022, when the United States was still a Party to the Paris Agreement. Including this data keeps the report accurate and comprehensive for all BTRs addressing the period it covers. The United States withdrew from the Paris Agreement in January 2026, and its inclusion reflects the reporting period only.

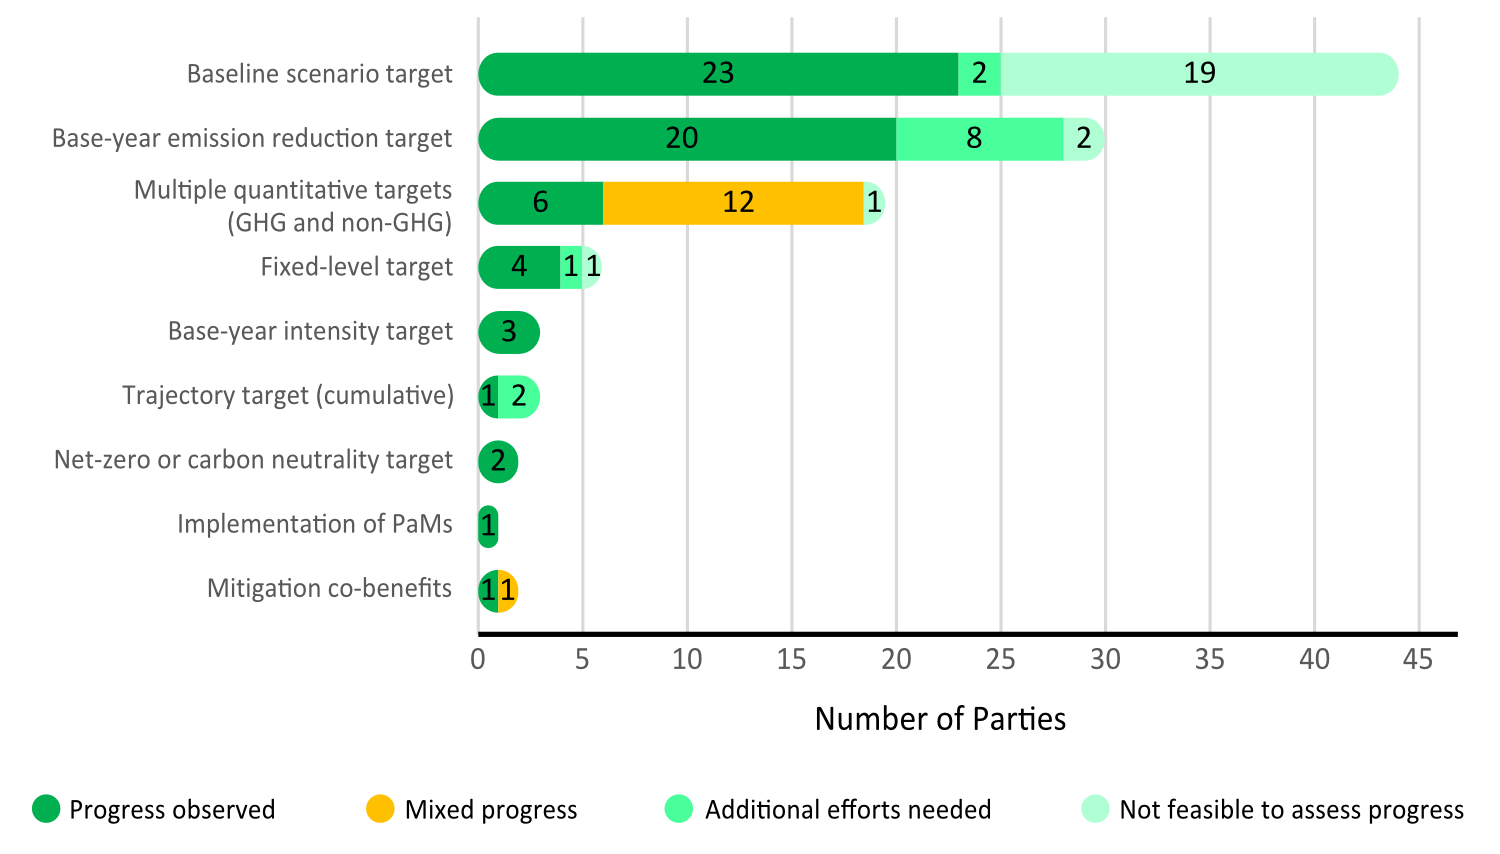
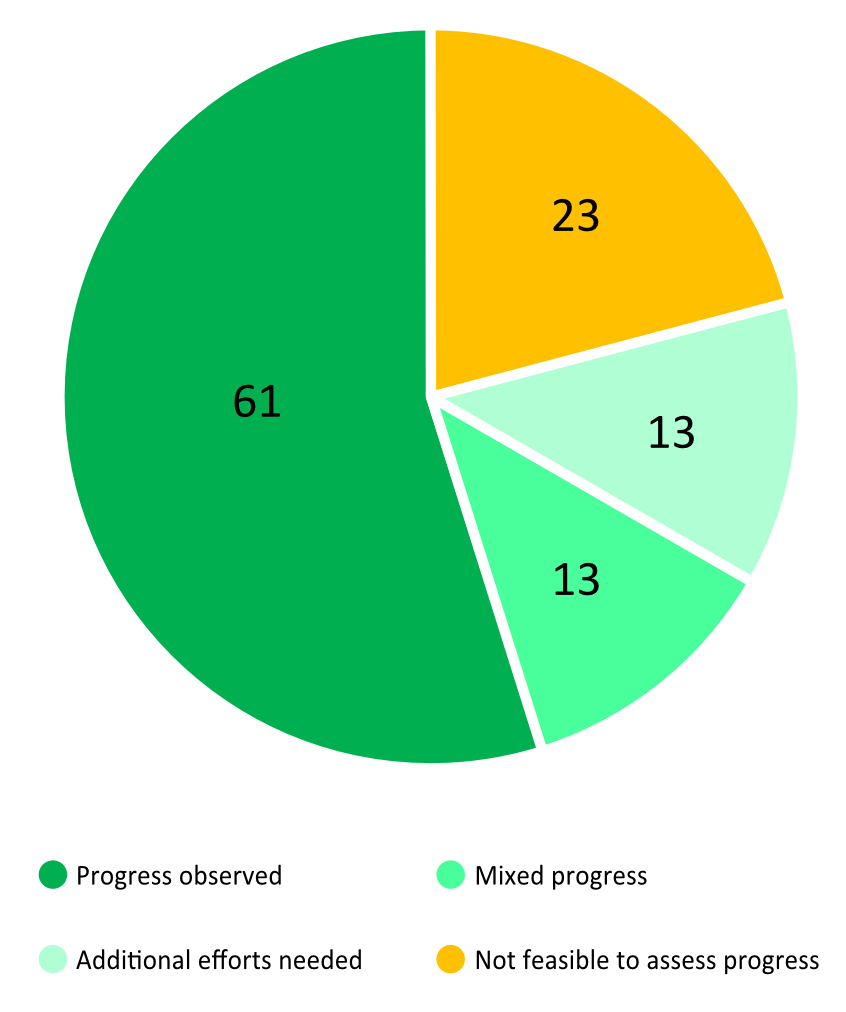
The updated assessment covers 110 Parties, which together represent approximately 85 per cent of global GHG emissions in 2020 (see figure 1). The number includes the European Union (EU) but excludes its 27 member States, as the EU and its member States have a joint NDC target. For 23 Parties, progress towards targets could not be assessed owing to missing or inconsistent information on indicators, reference points and baselines.

Sixty-one Parties for which assessment was feasible to conduct have made progress in this initial period of NDC implementation (see figure 2), moving closer to their targets by, for example, reducing emissions, keeping emissions below a baseline scenario, using an emission budget proportionally or increasing the share of renewables in energy consumption. Together, they represent 66.2 per cent of global GHG emissions in 2020.

Twenty-seven Parties either moved temporarily further from their targets, for example by increasing emissions or using an emission budget disproportionately, or, having multiple NDC targets, showed mixed progress, with some indicators on track, some needing additional efforts and some not feasible or too early to assess.

Figure 1. Progress towards nationally determined contributions, by target type

BTR_SR_2026_02_NDC_tracking_Figure1
资料来源: UN Climate Change

Figure 2. Overall progress towards nationally determined contributions, by number of Parties

BTR_SR_2026_02_NDC_tracking_Figure2
资料来源: UN Climate Change

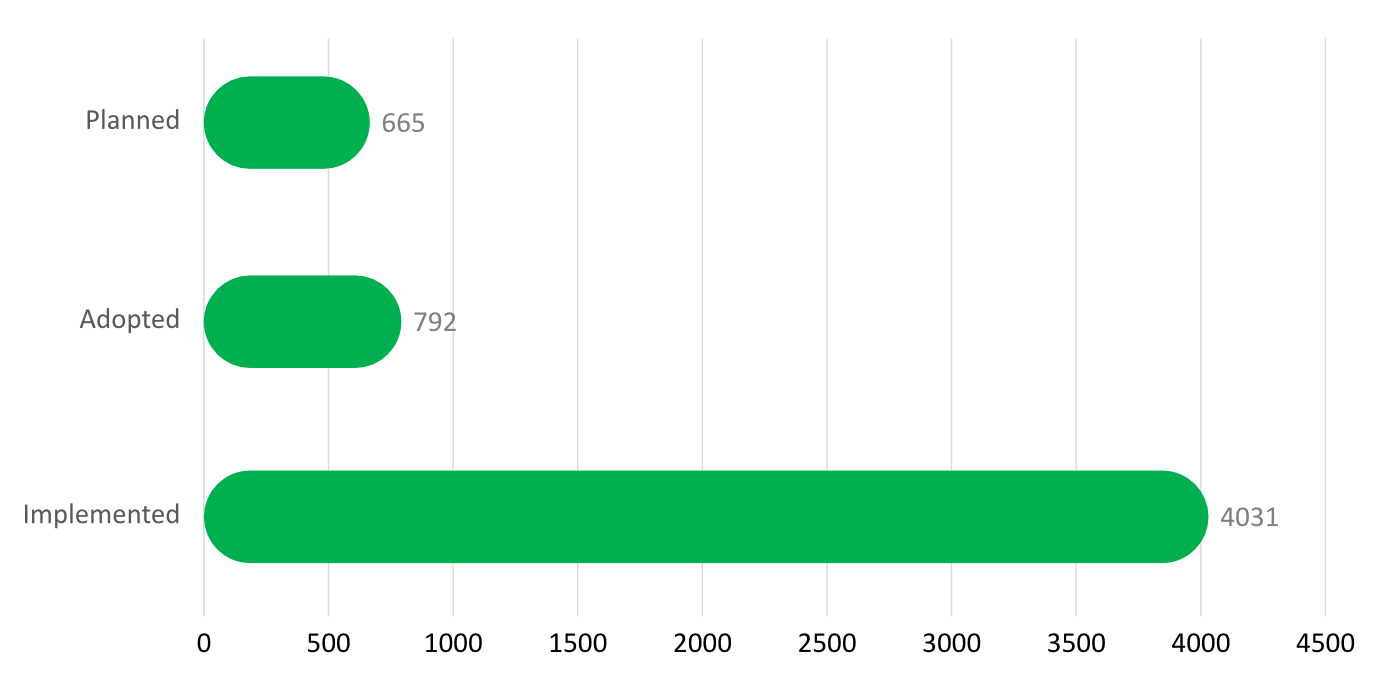
Climate policies aligned with the Paris Agreement are key to achieving NDC targets and enabling the transition to low-emission development. Parties reported nearly 5,800 policies and measures (PaMs) and actions, covering all gases and sectors, that they have planned, adopted or implemented to meet their NDC targets. Most were implemented after 2020 (figure 3), and 27 per cent of all reported PaMs are recently adopted or planned to enhance mitigation efforts towards Parties’ NDC targets and, in turn, the goals of the Paris Agreement.

Figure 3. Policies and measures reported, by implementation status

BTR_SR_2026_02a_PaMs_Figure2
资料来源: UN Climate Change

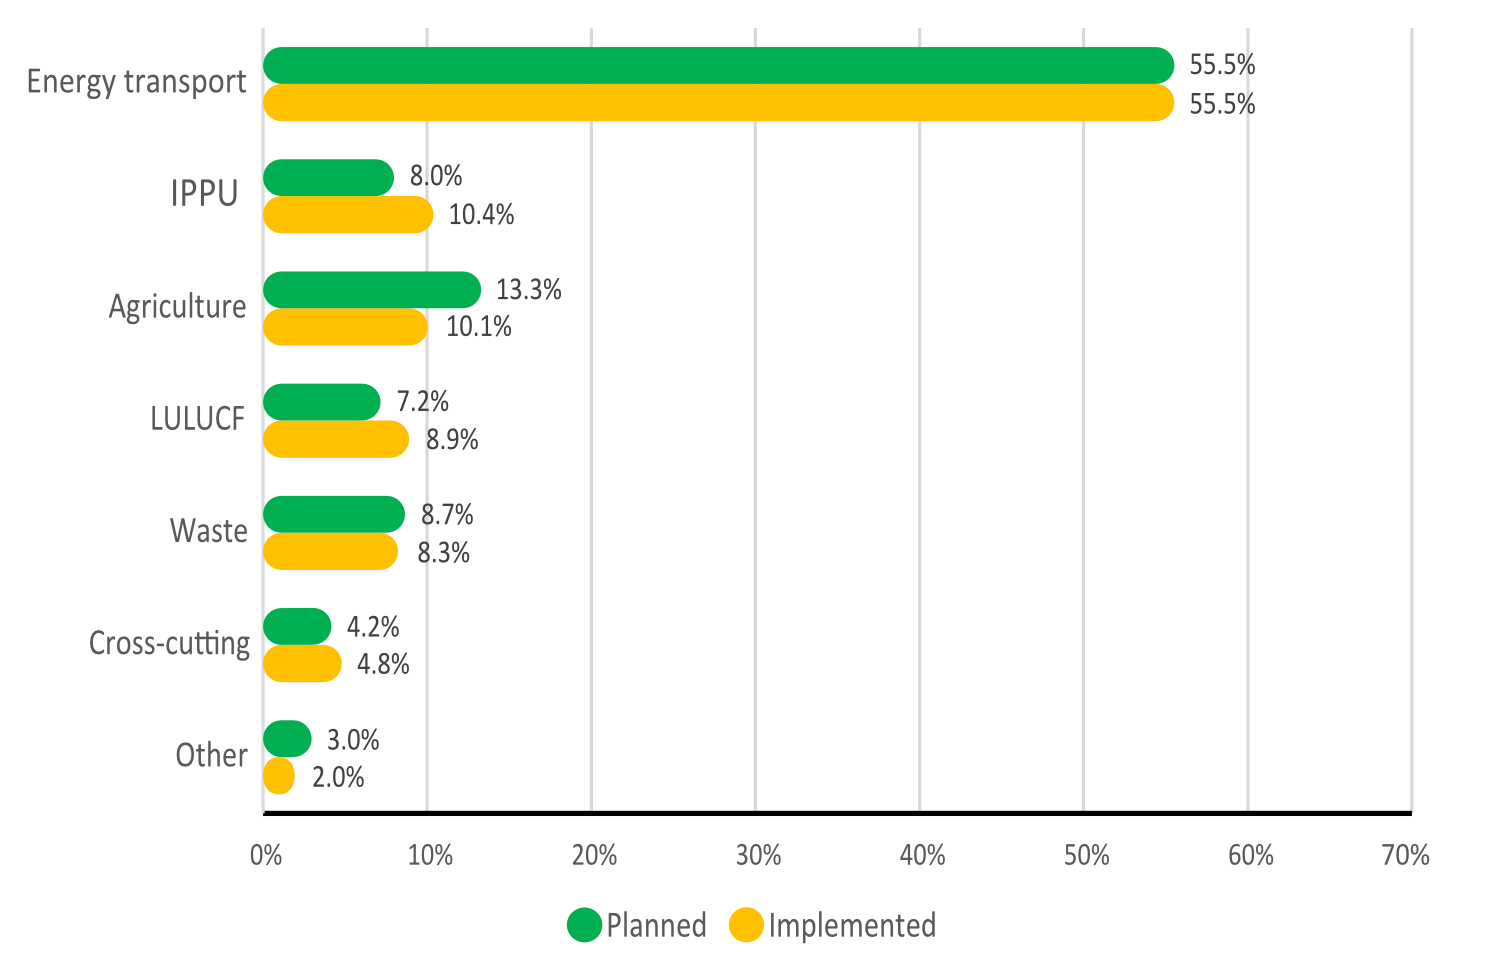
While the energy sector remains the mainstay of Parties’ mitigation PaMs, several have stepped up efforts in the agriculture and waste sectors, including through policies with higher abatement costs than before (see figure 4).

Figure 4. Share of planned and implemented policies and measures, by sector

BTR_SR_2026_02a_PaMs
资料来源: UN Climate Change

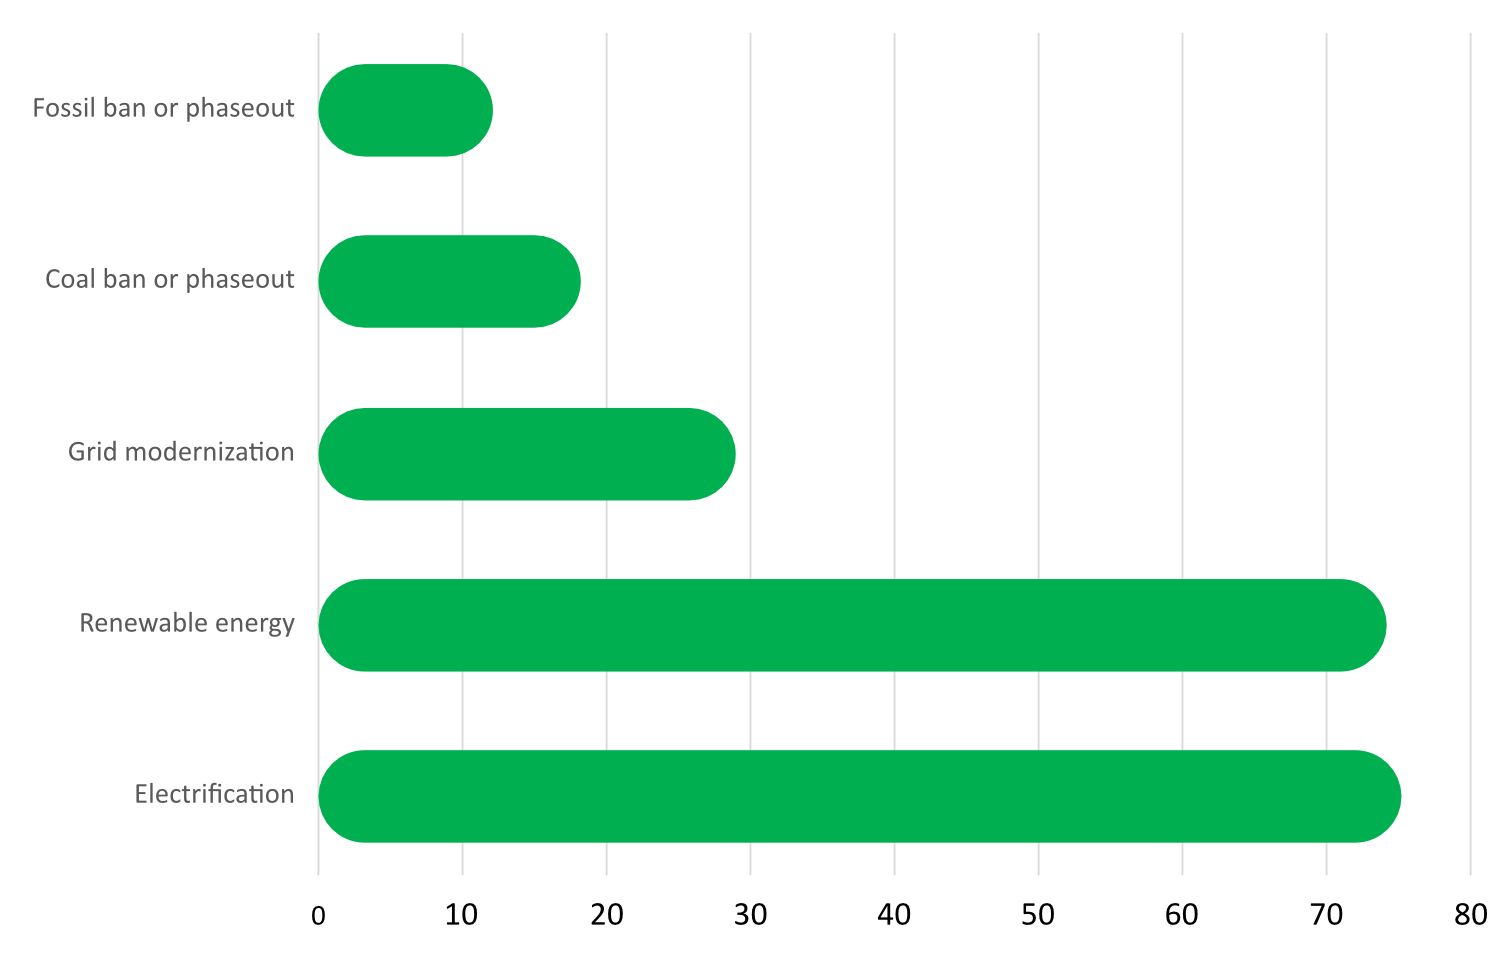
Most reported PaMs target the energy sector, prioritizing the transition to cleaner sources by electrifying transport, industry and building heating, increasing the share of renewables in the energy mix, phasing out unabated coal, upgrading electricity grids, introducing carbon and energy taxation, and promoting a modal shift in transport, electric vehicles and emission performance standards for new passenger cars and vans (see figure 5). Many Parties are transforming, or planning to transform, their energy systems, mainly by electrifying end uses and modernizing grids to integrate more renewable energy.

Figure 5. Energy sector policies and measures reported, by type

BTR_SR_2026_02a_PaMs_Figure3
资料来源: UN Climate Change

Adaptation is a central focus of the BTRs. Although reporting on it is not mandatory, 92 per cent of Parties included an adaptation component.

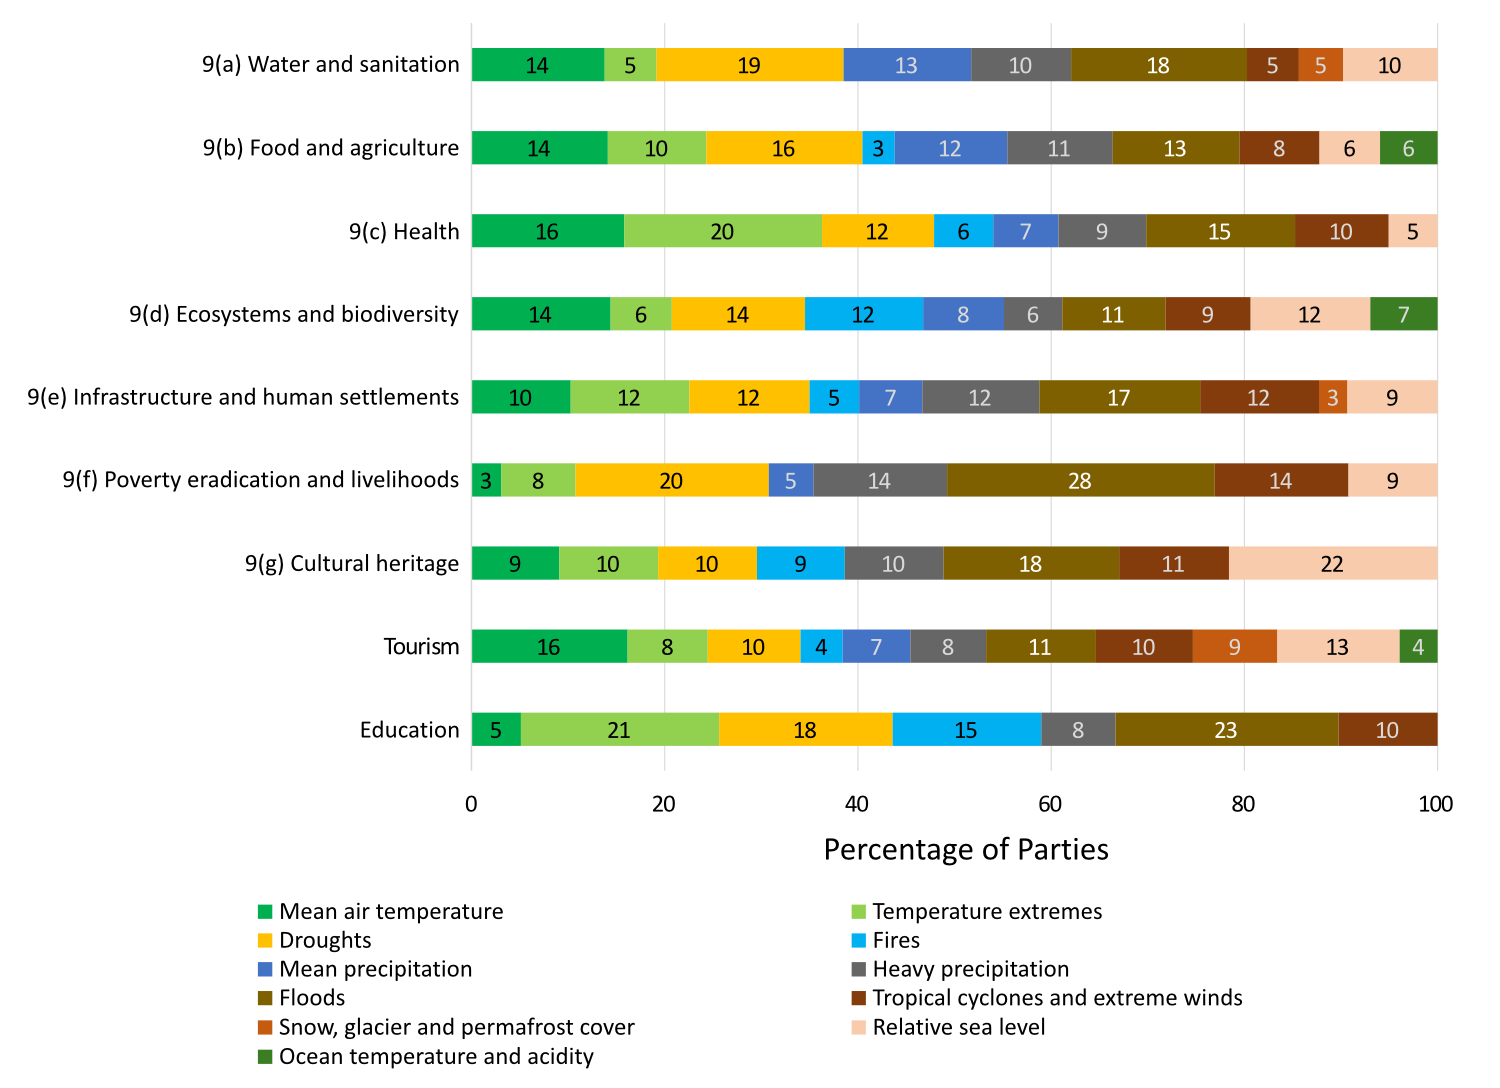
Parties consistently reported climate trends and impacts, particularly rising temperatures, droughts, flooding and changing precipitation. Food and agriculture, ecosystems and biodiversity, infrastructure and human settlements, water and sanitation, and health were among the most vulnerable and highest-priority sectors (see figure 11).

Figure 11. Share of adaptation components of biennial transparency reports covering climate change hazards and their impacts on priority sectors and areas, in the order of the thematic targets under the United Arab Emirates Framework for Global Climate Resilience

BTR_SR_2026_04_Adaptation_Figure1
资料来源: UN Climate Change

Note: The numbers in parentheses refer to the thematic targets under the United Arab Emirates Framework for Global Climate Resilience set out in decision 2/CMA.5, para. 9.

Almost all (97 per cent) Parties reported on their domestic adaptation priorities, covering a wide range of sectoral, cross-sectoral and institutional areas. Food and agriculture, and water and sanitation, were the highest-priority sectors. Almost all Parties (93 per cent) also reported progress in implementing adaptation across sectors and areas, showing broad but incomplete alignment between priorities and implementation.

Nearly half of all Parties described how the United Arab Emirates Framework for Global Climate Resilience guides their adaptation actions, and one quarter of them explicitly linked their implemented adaptation measures to the thematic and dimensional targets (see figure 12).

Figure 12. Shares of adaptation components of biennial transparency reports referring to specific adaptation priorities in sectors and areas, progress made in implementing adaptation, and the explicit reference between implemented adaptation measures and the targets under the United Arab Emirates Framework for Global Climate Resilience

BTR_SR_2026_04_Adaptation_Figure2
资料来源: UN Climate Change

Note: The numbers in parentheses refer to the thematic and dimensional targets under the United Arab Emirates Framework for Global Climate Resilience set out in decision 2/CMA.5, paras. 9 and 10.

However, only about one quarter of Parties reported on the results of implemented adaptation actions and on their effectiveness and sustainability. These Parties typically highlighted improvements in data, indicators and methodologies, reflecting efforts to strengthen the evidence base for adaptation decision-making. They also noted improved institutional coordination, including stronger vertical and horizontal alignment, as well as improved decision-making processes for adaptation financing.

Over a third of Parties highlighted the importance of community-based adaptation and participatory planning, such as engagement with Indigenous Peoples and local communities. Other key good practices were applying data-driven approaches, building capacity to strengthen institutional readiness and local technical skills, mainstreaming adaptation into sectoral frameworks and promoting innovation in finance and resource mobilization.


Of the 137 BTR1s synthesized, 88 report on loss and damage. The scope and depth of reporting vary considerably: about half provide one page or less of information, while six devote more than 10 pages. Some Parties refer readers to adaptation chapters or national adaptation plans rather than providing dedicated content. A total of 82 Parties described activities to avert, minimize or address loss and damage, while 51 reported specific losses. In the absence of standardized methodologies and reporting guidance, Parties used varied approaches and framings, limiting comparability and synthesis.

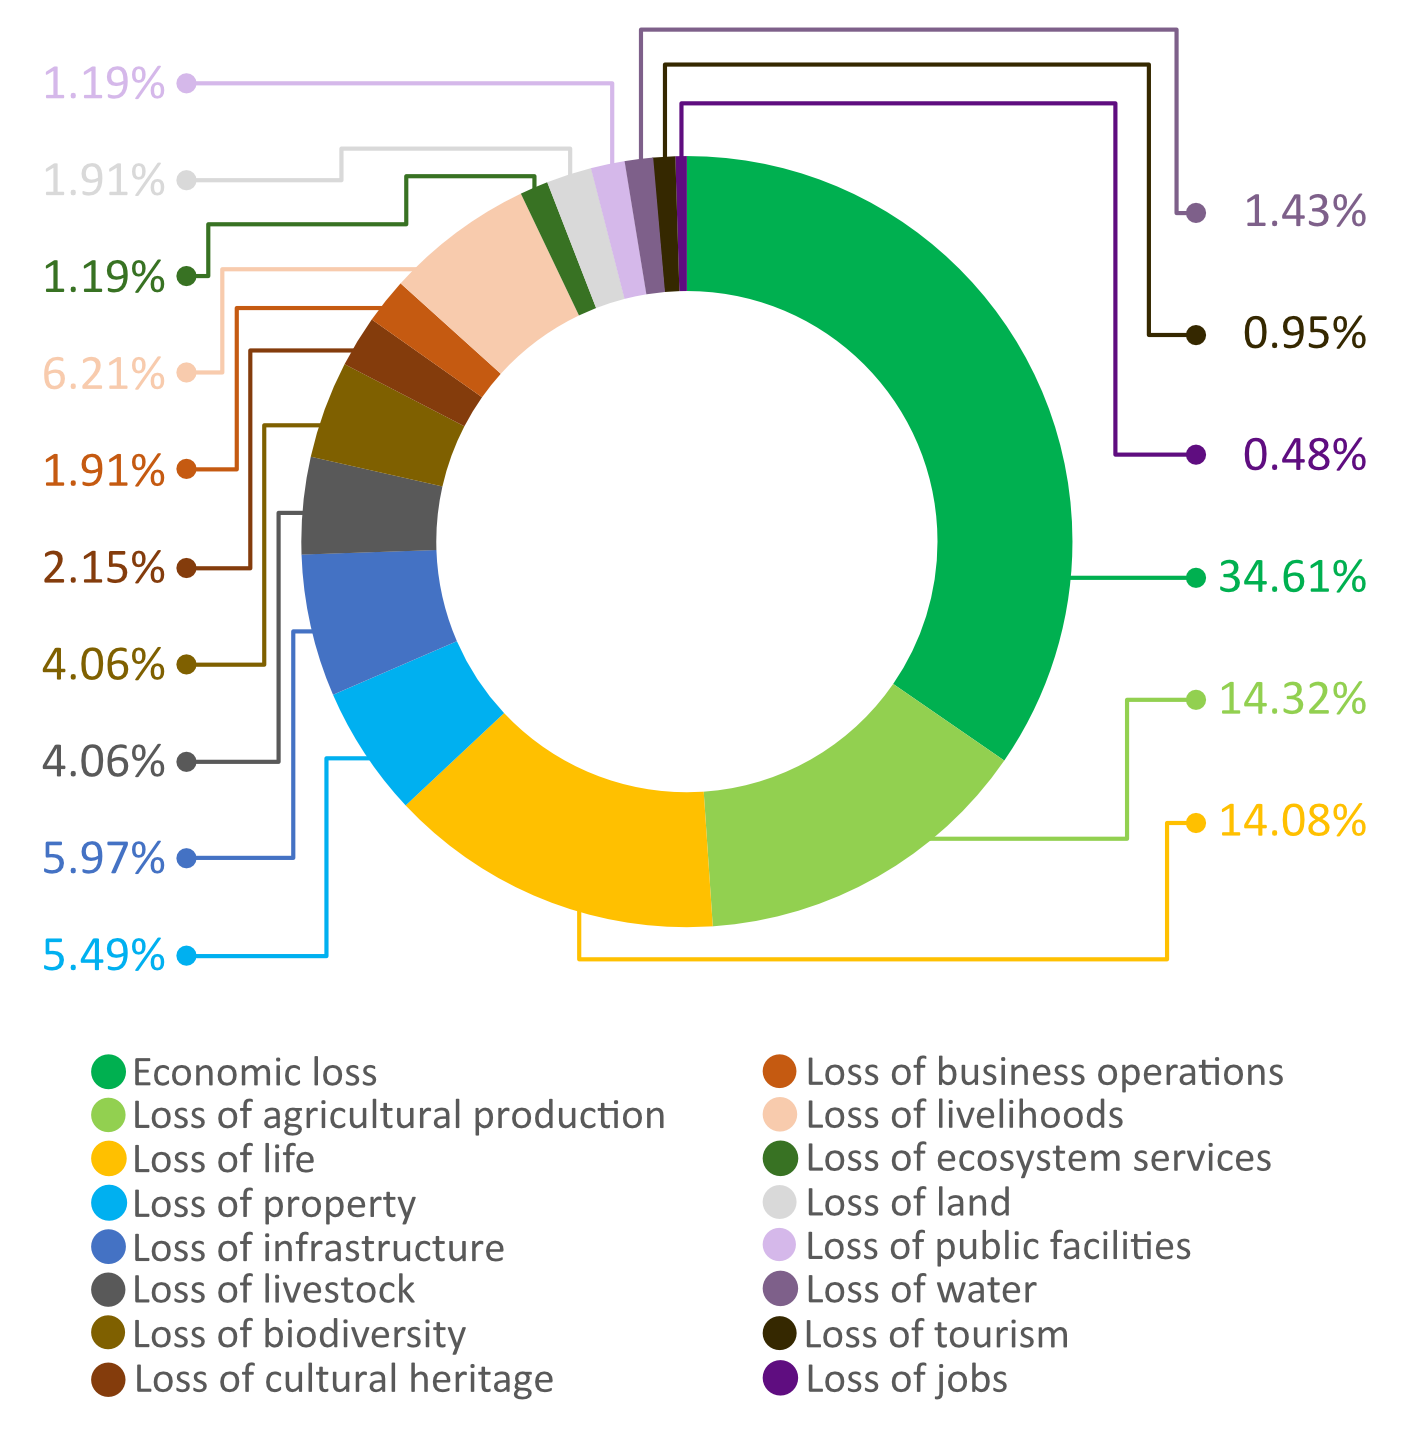
 Among the 51 Parties that reported specific losses, economic loss, loss of agricultural production and loss of life account for 63 per cent of the 419 losses reported across 16 categories (see figure 13). Economic loss, including generic references to the term, is the most frequently reported category (34.6 per cent), appearing in 46 BTR1s. Monetary values accompany 92 per cent of economic loss entries, indicating a tendency to report losses that can be tracked financially. Breadth varies: the median Party reported four loss categories, 10 reported only one and 24 reported five or more. Floods, storms and droughts are the hazards most often associated with reported losses.

Figure 13. Loss associated with climate change impacts reported, by type

BTR_SR_2026_04a_Loss&Damage_Figure2
资料来源: UN Climate Change


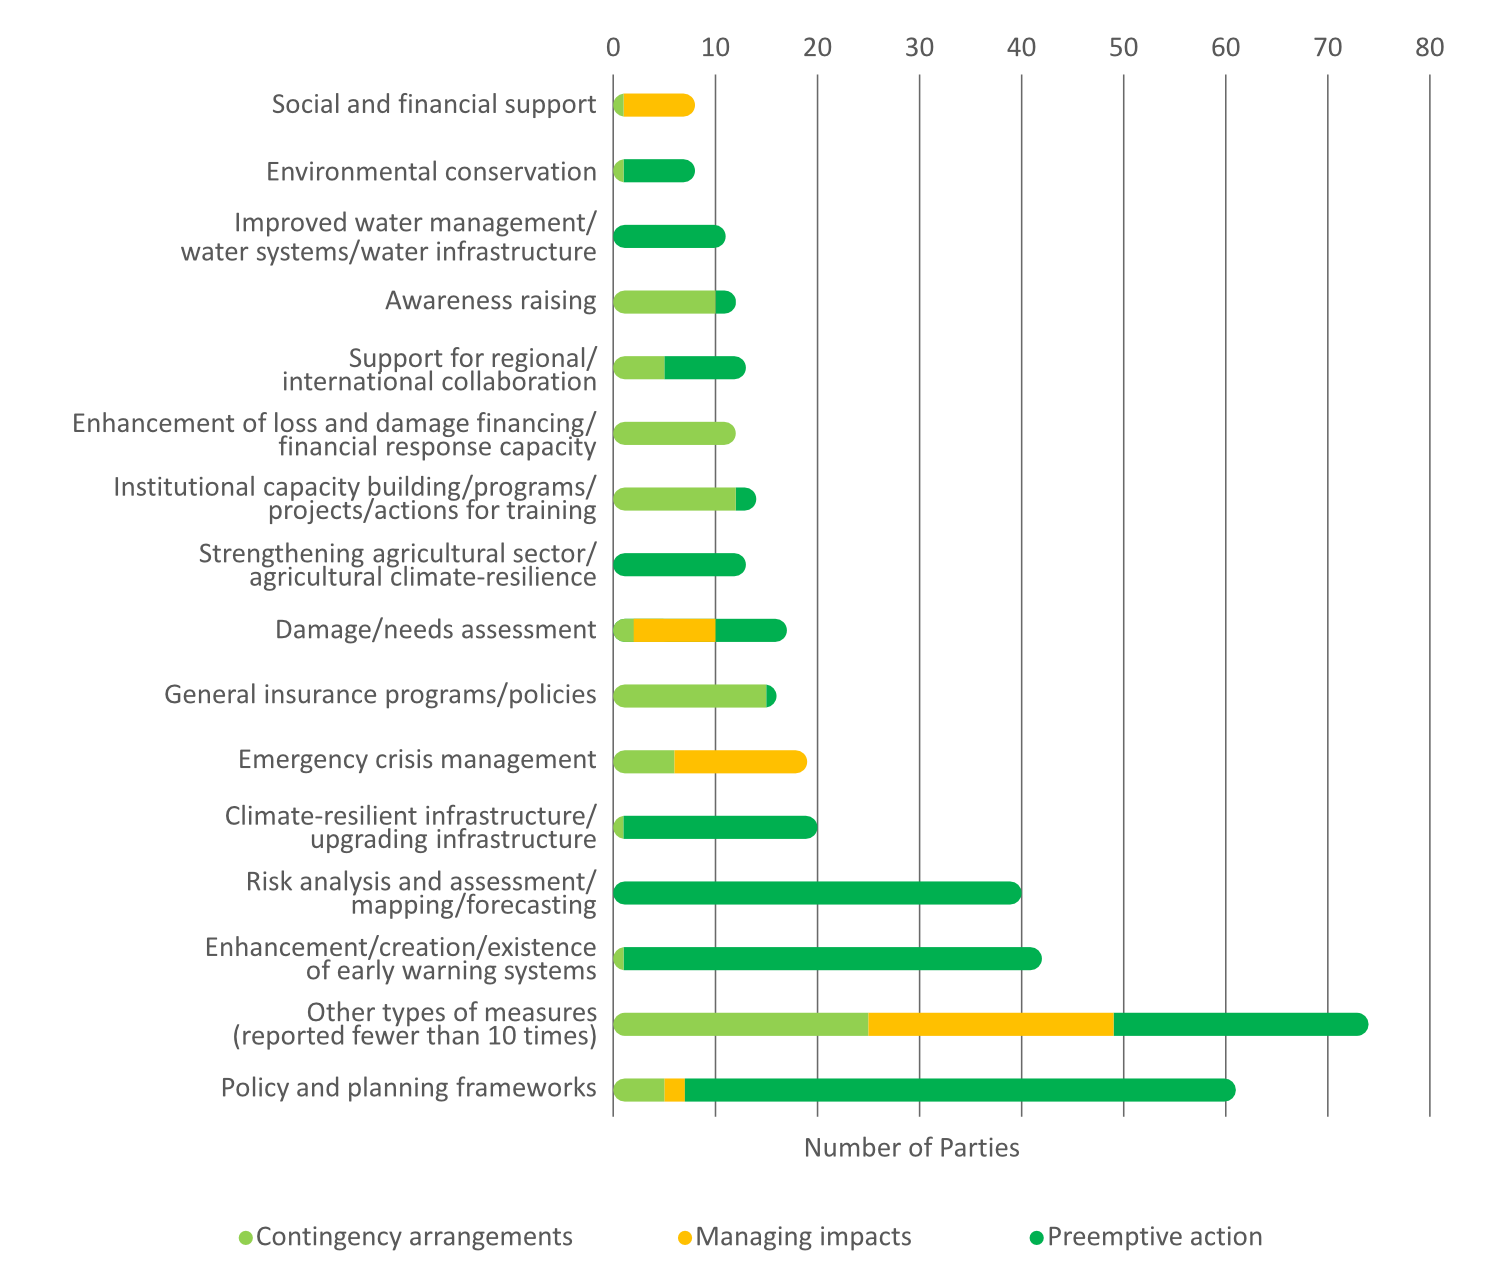
Parties reported more than 600 activities, actions, measures, systems, frameworks, policies, initiatives and plans related to loss and damage. Of these reported activities, only 22 per cent were described in terms of “averting, minimizing and addressing” loss and damage. The most widely reported activities are policy and planning frameworks, early warning systems, risk analysis and assessment, climate-resilient infrastructure and emergency crisis management. Reported actions span pre-emptive activities, contingency arrangements and actions to manage impacts; pre-emptive activities are reported most often and actions to manage impacts least often (see figure 14).


An analysis of 18 new BTR1s that contain information on loss and damage, submitted since the first synthesis in 2025, shows emerging shifts in reporting practices: the use of the “averting, minimizing and addressing” framing is more prevalent in these BTRs, appearing in 39 per cent of the submissions, compared with 16 per cent of the BTRs covered by the 2025 synthesis (the previous cohort). However, the small sample, which included several small island developing States and coastal States, makes it premature to call these established trends.

These new BTR1s report activity types more widely than the previous cohort. Regional and international collaboration features in 44 per cent of submissions, compared with 6 per cent of the previous cohort. Emergency crisis management, climate-resilient infrastructure, coastal management and flood defence, and agricultural strengthening are also reported by a substantially higher proportion of Parties in the new BTR1s, while contingency arrangements account for 28 per cent of reported activities, compared with 18 per cent in the previous cohort.


Institutional arrangements are also more visible: 65 per cent of reported activities in the new BTR1s are linked to an identifiable arrangement, compared with 49 per cent in the BTRs analysed in the previous cohort.

Figure 14. Activities related to averting, minimizing and addressing loss and damage reported, by type

BTR_SR_2026_04a_Loss&Damage_Figure1
资料来源: UN Climate Change

The BTR1s show an increase in financial, technology and capacity-building support provided to developing countries for climate action in the 2021–2022 biennium.

Financial support

Reported annual average climate finance, primarily from developed country Parties, largely aligns with recipient countries’ priorities, flowing mainly to energy and transport for mitigation and to agriculture and food supply for adaptation (see figure 15). A gap remains for multi-sectoral adaptation needs.

Figure 15. Financial support reported as provided and mobilized, and needed and received, by thematic area

BTR_SR_2026_03a_Finance_Figure2
资料来源: UN Climate Change

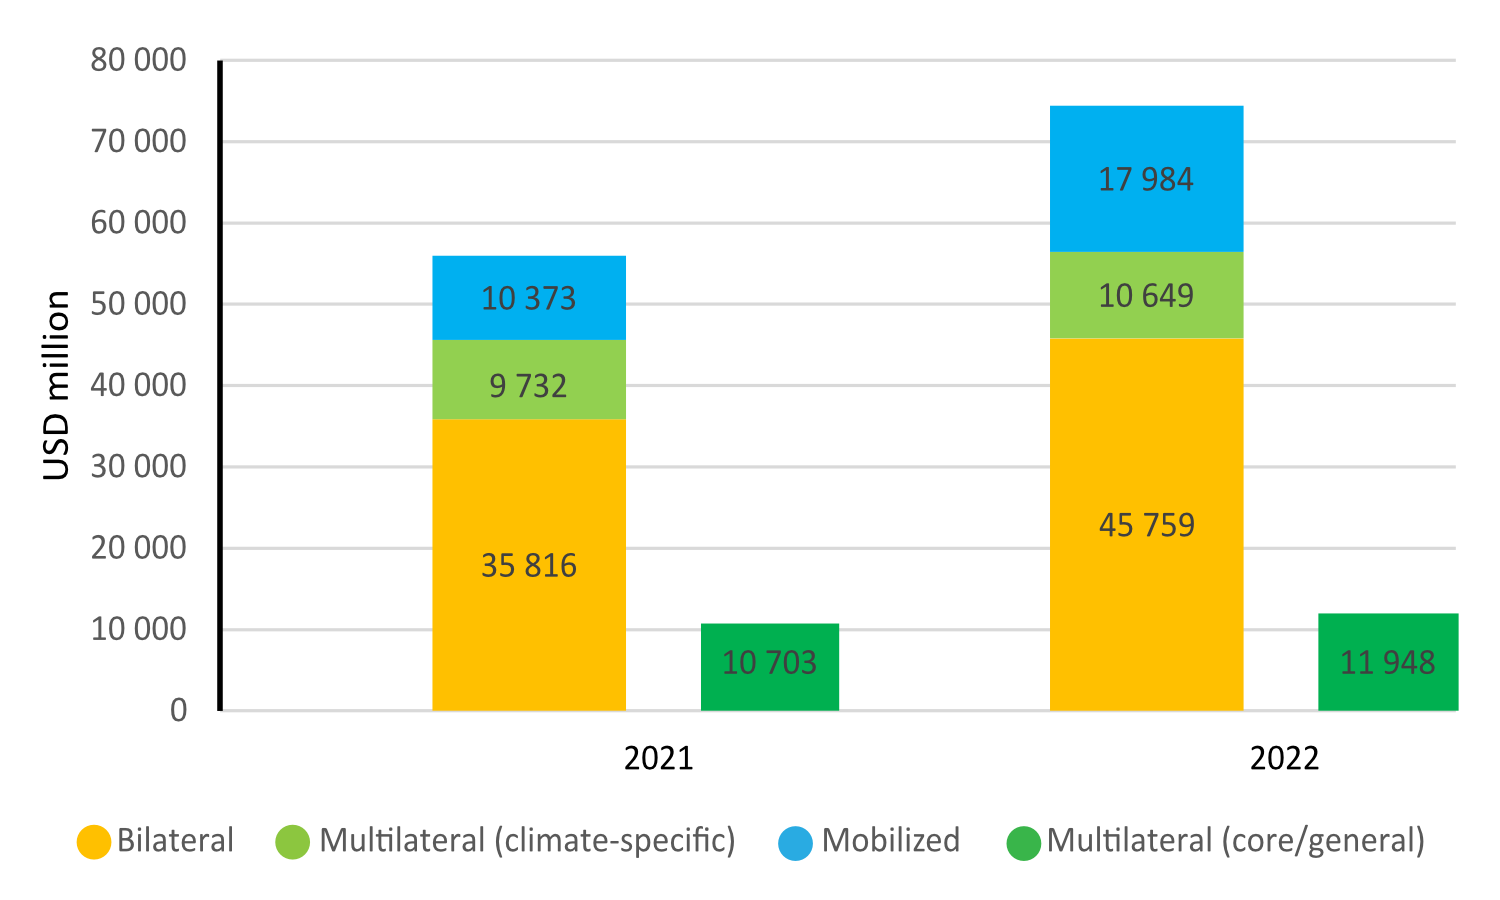
The annual average climate-specific finance provided and mobilized by 41 Parties reached USD 65.16 billion in 2021–2022, including finance provided through bilateral, regional and other channels, climate-specific multilateral finance and climate finance mobilized through public interventions (see figure 16). The 41 Parties include all Parties that reported finance provided or mobilized under any of these categories in either reporting year. Developed country Parties provided or mobilized 97.1 per cent of the total. Most support took the form of grants and concessional instruments.

Figure 16. Financial support reported as provided through bilateral, regional and other channels, multilateral channels and mobilized through public interventions in 2021–2022

BTR_SR_2026_03a_Finance_Figure1
资料来源: UN Climate Change

A total of 40 Parties reported detailed information on financial support provided through bilateral, regional and other channels, either in a separate file or in the text of the BTR. This support averaged USD 40.79 billion annually in 2021–2022.

Thirty-five Parties reported financial support provided through multilateral channels in at least one of the two reporting years, with annual averages in 2021–2022 of USD 10.19 billion for climate-specific purposes and USD 11.33 billion for core/general purposes (see figure 17).

A total of 51 developing country Parties reported needing nearly USD 6.9 trillion for climate action (mostly before 2030). In addition, 77 Parties reported receiving USD 91.19 billion in financial support, either in a separate file or in the text of the BTR. Many developing countries are still establishing systems for collecting and tracking information on support received, so not all could report on support received or needed in their BTRs.

Figure 17. Total financial support reported as provided through multilateral channels in 2021–2022, by entity

BTR_SR_2026_03a_Finance_Figure3
资料来源: UN Climate Change


Technology development and transfer support

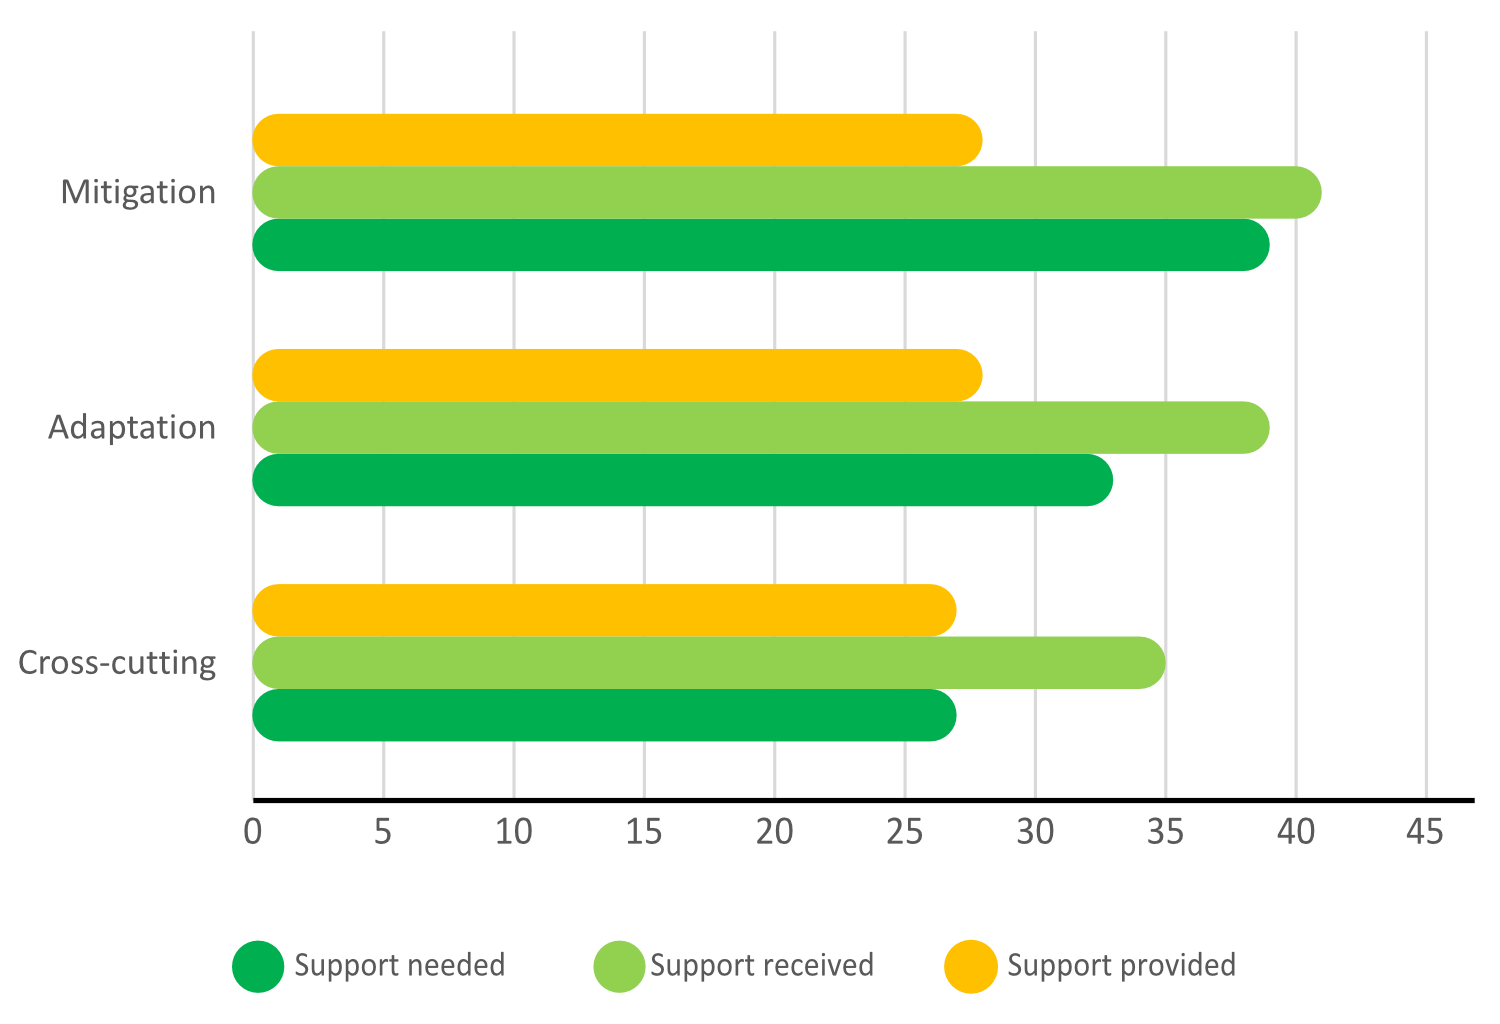
Information on technology development and transfer support appears in 92 per cent of BTR1s, covering 3,410 reported activities or measures (see figure 18). Sectoral priorities for technology support broadly align with those in the latest NDCs, and mitigation-related support is reported by more Parties than adaptation-related support (see figure 19). Reported measures and activities focused mainly on hardware and infrastructure for climate technology development and transfer, and on institutional strengthening. A total of 31 Parties indicated that their identified needs for technology development and transfer support were informed by technology needs assessments (TNAs), while 12 reported a need to update, complete or undertake the TNA process. Bilateral channels accounted for 80 per cent of reported support provided, and support received went primarily to public-sector entities. Private-sector involvement as a recipient remained limited, although 50 per cent of Parties reporting support provided highlighted the private sector’s role in advancing technology development and transfer.

Figure 18. Regional distribution of the reported information on activities and measures relating to technology development and transfer support provided, needed and received in BTR1s, by activity

BTR_SR_2026_03b_Tech_Transfer_Figure1
资料来源: UN Climate Change

Figure 19. Parties that reported information on technology development and transfer support provided, needed and received across activities focused on mitigation, adaptation and cross-cutting issues in BTR1s, by Party

BTR_SR_2026_03b_Tech_Transfer_Figure2
资料来源: UN Climate Change

Capacity-building support

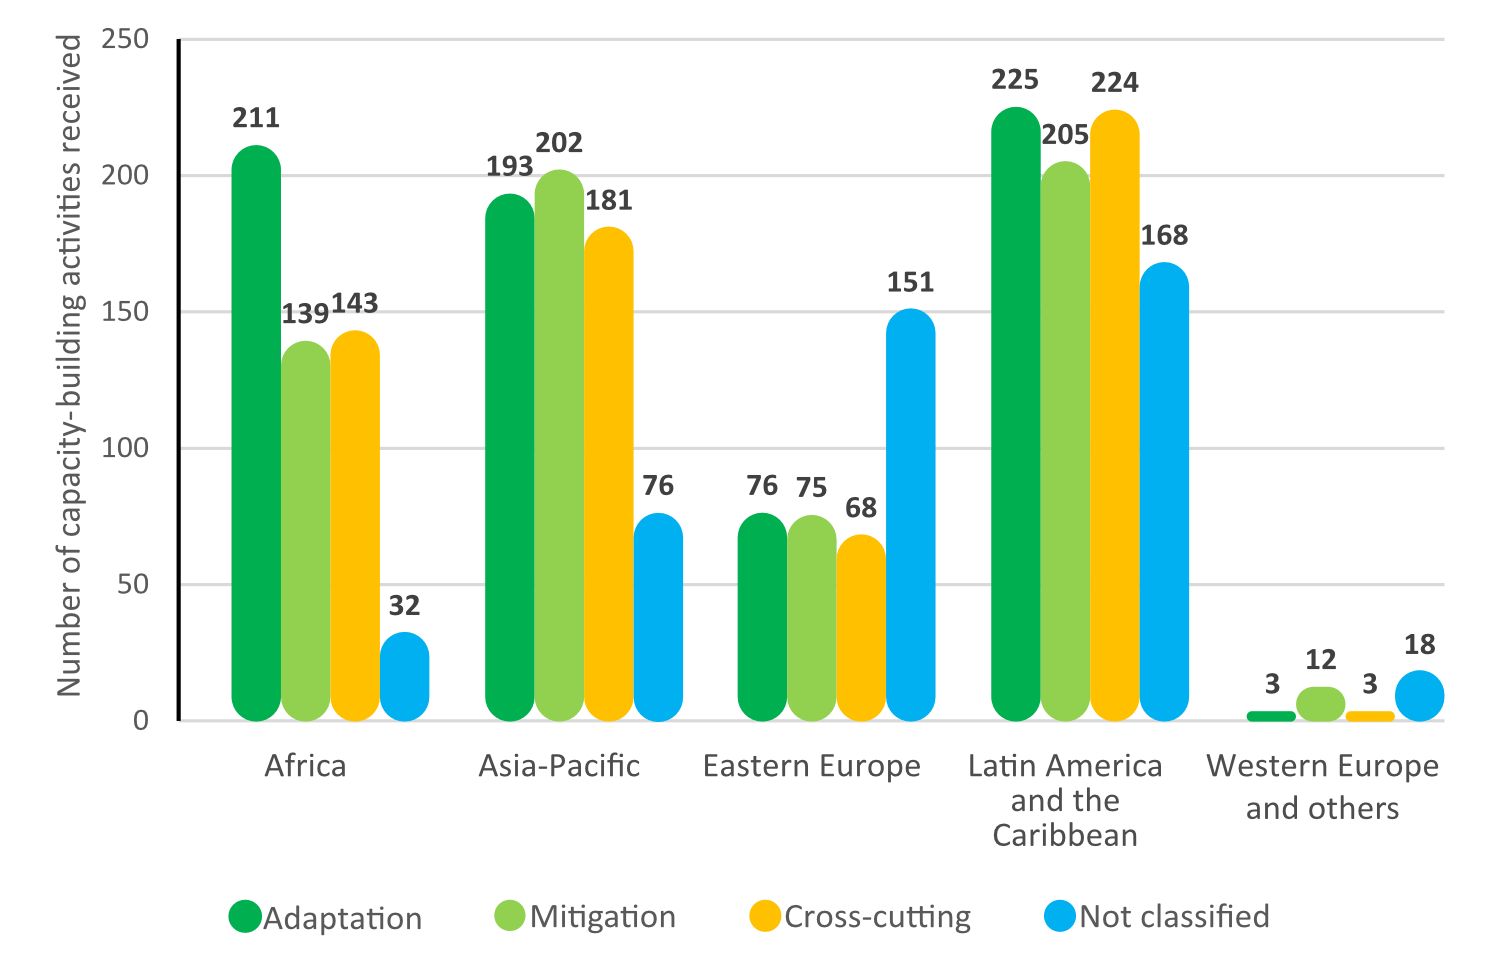
Information on capacity-building support appears in 82.6 per cent of BTR1s: 42 Parties reported support provided, 75 reported support received, including three that reported both. A total of 8,563 capacity-building activities were reported as support provided, focusing primarily on adaptation (61.1 per cent), followed by cross-cutting areas (20.7 per cent) and mitigation (18.2 per cent). Africa (31.7 per cent), Asia and the Pacific (21.7 per cent) and Latin America and the Caribbean (15.6 per cent) were the main destinations of this support, of which 54.1 per cent of activities were completed and 43.8 per cent were ongoing. A total of 69 Parties reported 1,850 capacity-building needs, mainly related to adaptation (39.5 per cent), mitigation (30.2 per cent) and cross-cutting areas (22.5 per cent), including institutional readiness, climate finance, technology deployment, transparency systems, loss and damage, and carbon markets. A further 53 Parties reported transparency-related needs. Seventy-five Parties reported capacity-building support received, covering 2,405 activities across adaptation (29.4 per cent), mitigation (26.3 per cent) and cross-cutting areas (25.7 per cent); 18.6 per cent of activities were not classified. Latin America and the Caribbean reported the largest number of activities received (822), followed by Asia and the Pacific (652) and Africa (525) (see figure 20). Support commonly focused on technical training, institutional strengthening, climate finance readiness, renewable energy and ETF-related transparency capacities, including preparation of BTRs and NIRs, GHG inventory systems and quality assurance and quality control.

Figure 20. Capacity-building activities received, by region and area

BTR_SR_2026_03c_Capacity_Building_Figure1
资料来源: UN Climate Change

The BTR1s show a strong commitment by Parties to a whole-of-society approach to climate action, recognizing it as a collective effort that extends far beyond government. This involves engaging a wide array of non-Party stakeholders, including the private sector, civil society and local communities, and integrating diverse perspectives, such as those of women, youth and Indigenous Peoples, to make climate policy more inclusive, effective and representative. The approach also fosters synergies between climate action and the Sustainable Development Goals (SDGs) by embedding climate policies in national development plans to maximize socioeconomic co-benefits and a just transition (see figure 21).

Most Parties (about 80 per cent) reported involving a broad spectrum of non-Party stakeholders, including the private sector, civil society organizations, academic and research institutions, local communities and international organizations, in preparing climate-related reports (e.g. BTRs) and in policy development and implementation, through targeted stakeholder consultations, public discussions and initiatives, and multi-stakeholder councils and thematic working groups that support inclusive, representative and effective climate action.

Parties are working to integrate the needs and contributions of marginalized groups: nearly 76 per cent explicitly considered gender in their climate action and over half engaged and empowered youth. Parties with Indigenous populations recognize and integrate Indigenous Peoples’ traditional knowledge in national climate change policies and strategies.

Nearly all Parties (92 per cent) explicitly link climate action with broader sustainable development goals – such as those related to clean energy, sustainable cities and communities, sustainable production and consumption, green growth, high quality of life and a socially inclusive transition – by embedding climate targets and resilience goals in their long-term national development plans.

Figure 21. Percentage of Parties reporting on a whole-of-society approach

BTR_SR_2026_06_WoS_Approach&Other_matters
资料来源: UN Climate Change

The synthesis of 137 BTR1s indicates that Parties are working to establish robust domestic transparency arrangements – including legal frameworks, institutional coordination and centralized data systems – to meet the enhanced requirements of the ETF. Despite these efforts, many developing countries face significant institutional, technical, data quality and human resource constraints, and so apply flexibility provisions to fulfil their reporting obligations.

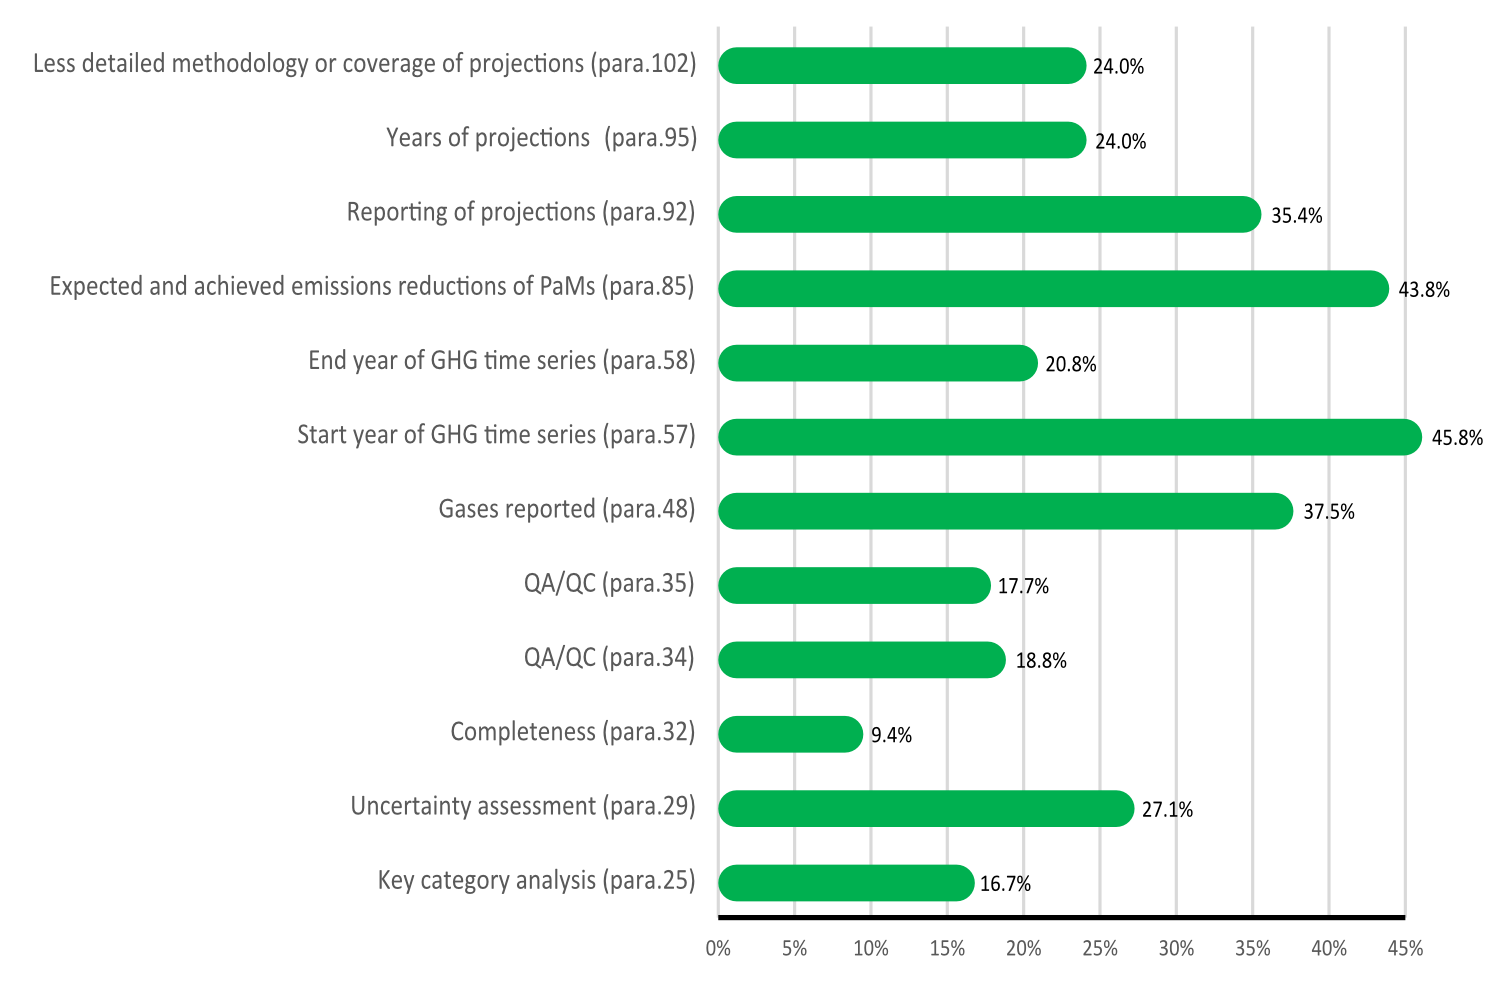
Of the 96 developing country Parties considered among the 137 Parties, 74 applied at least one of the 12 flexibility provisions in the modalities, procedures and guidelines (see figure 22), primarily owing to data availability-related and technical constraints (e.g. reliance on lower-tier methodologies of the Intergovernmental Panel on Climate Change (IPCC) owing to a lack of country-specific data, and insufficient domestic systems for tracking finance received) and institutional constraints (e.g. weak inter-agency coordination and unclear data-sharing mandates).

Figure 22. Flexibilities applied by developing country Parties, by reporting requirement

BTR_SR_2026_05_Transparency_Figure1
资料来源: UN Climate Change

Sixty-nine developing country Parties articulated clear capacity-building needs in their BTRs and 52 outlined improvement plans for future reporting cycles (see figure 23). Capacity-building needs were mostly identified for applying higher-tier IPCC methodologies, developing country-specific emission factors, using tracking and accounting tools to monitor NDC implementation and target achievement, creating robust monitoring and evaluation systems for adaptation, and establishing better systems for tracking financial and technological support.

Figure 23. Capacity constraints reported, by type of constraint

BTR_SR_2026_05_Transparency_Figure2
资料来源: UN Climate Change
Content