The BTR1s show an increase in financial, technology and capacity-building support provided to developing countries for climate action in the 2021–2022 biennium.
Financial support
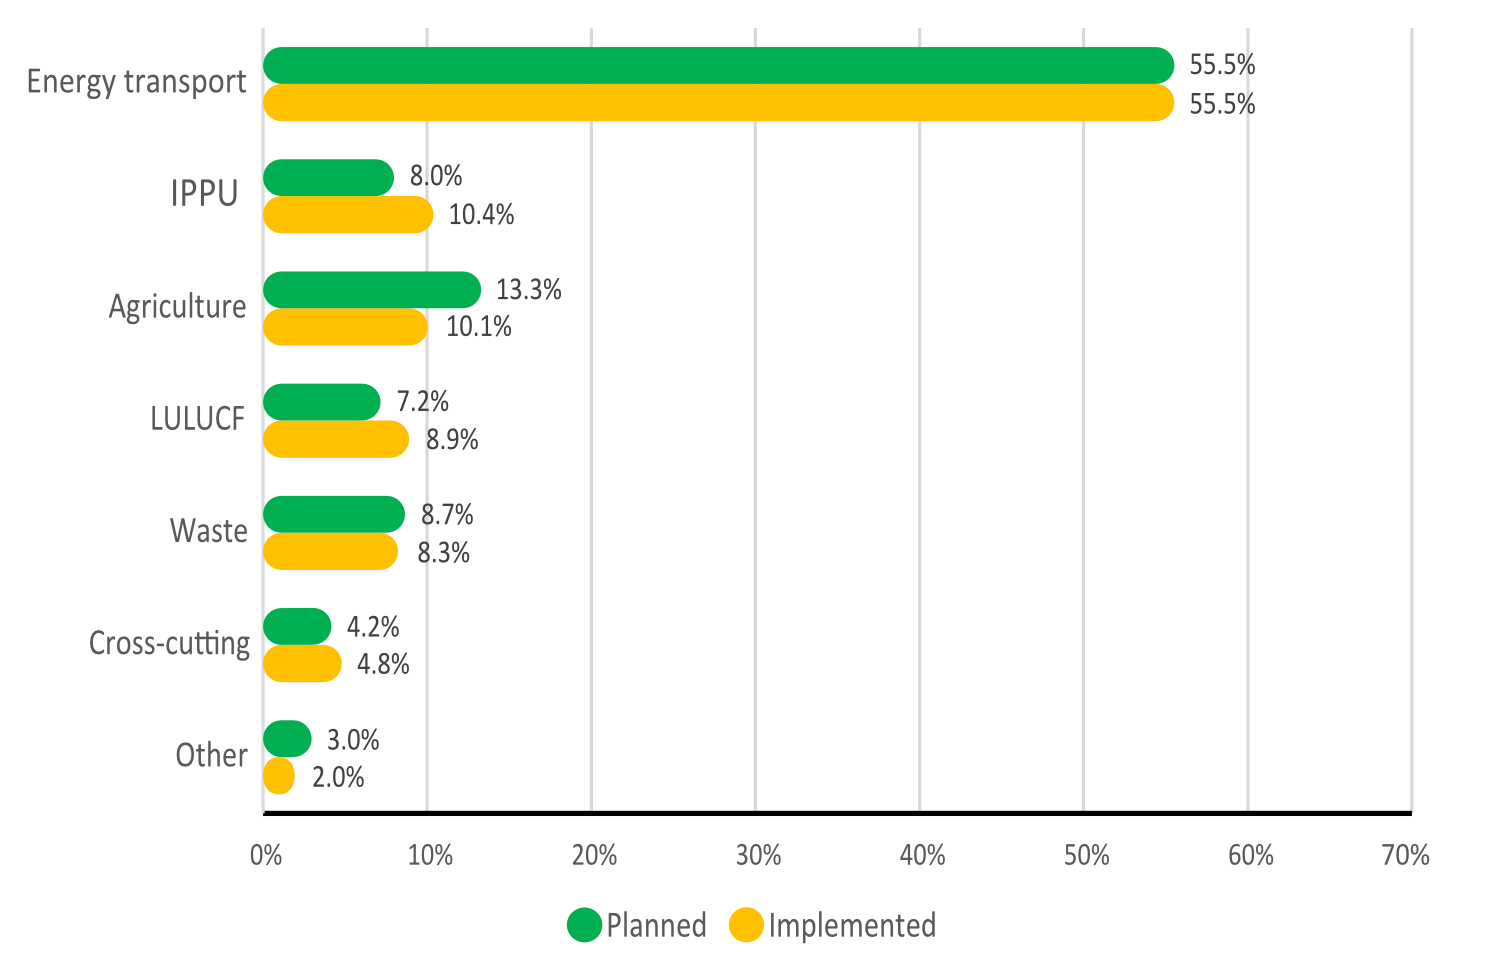
Reported annual average climate finance, primarily from developed country Parties, largely aligns with recipient countries’ priorities, flowing mainly to energy and transport for mitigation and to agriculture and food supply for adaptation (see figure 15). A gap remains for multi-sectoral adaptation needs.
Figure 15. Financial support reported as provided and mobilized, and needed and received, by thematic area
Credit: UN Climate Change
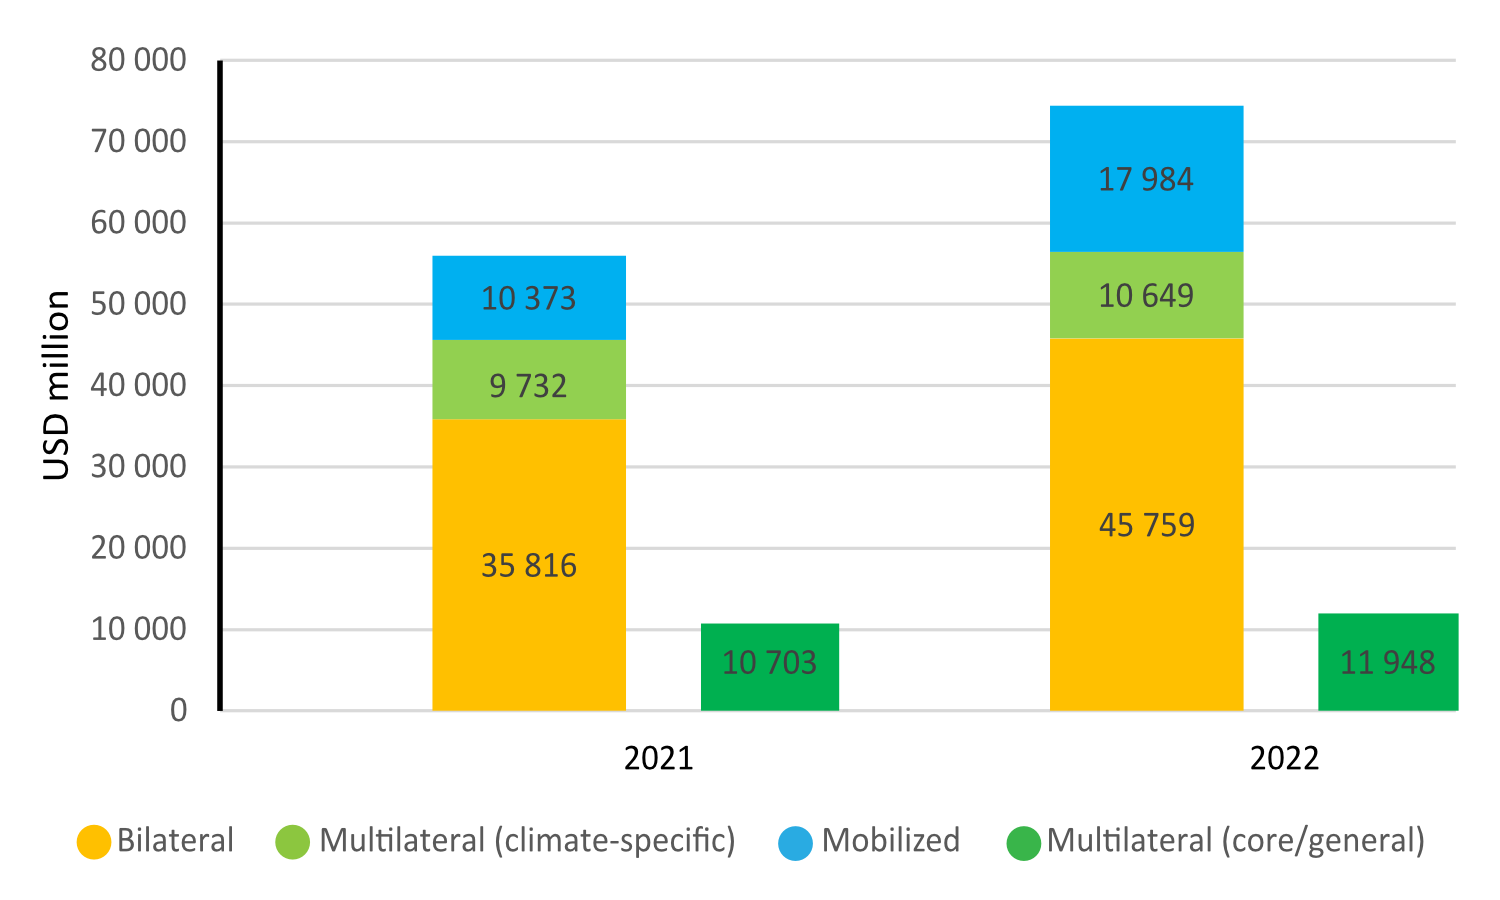
The annual average climate-specific finance provided and mobilized by 41 Parties reached USD 65.16 billion in 2021–2022, including finance provided through bilateral, regional and other channels, climate-specific multilateral finance and climate finance mobilized through public interventions (see figure 16). The 41 Parties include all Parties that reported finance provided or mobilized under any of these categories in either reporting year. Developed country Parties provided or mobilized 97.1 per cent of the total. Most support took the form of grants and concessional instruments.
Figure 16. Financial support reported as provided through bilateral, regional and other channels, multilateral channels and mobilized through public interventions in 2021–2022
Credit: UN Climate Change
A total of 40 Parties reported detailed information on financial support provided through bilateral, regional and other channels, either in a separate file or in the text of the BTR. This support averaged USD 40.79 billion annually in 2021–2022.
Thirty-five Parties reported financial support provided through multilateral channels in at least one of the two reporting years, with annual averages in 2021–2022 of USD 10.19 billion for climate-specific purposes and USD 11.33 billion for core/general purposes (see figure 17).
A total of 51 developing country Parties reported needing nearly USD 6.9 trillion for climate action (mostly before 2030). In addition, 77 Parties reported receiving USD 91.19 billion in financial support, either in a separate file or in the text of the BTR. Many developing countries are still establishing systems for collecting and tracking information on support received, so not all could report on support received or needed in their BTRs.
Figure 17. Total financial support reported as provided through multilateral channels in 2021–2022, by entity
Credit: UN Climate Change
Technology development and transfer support
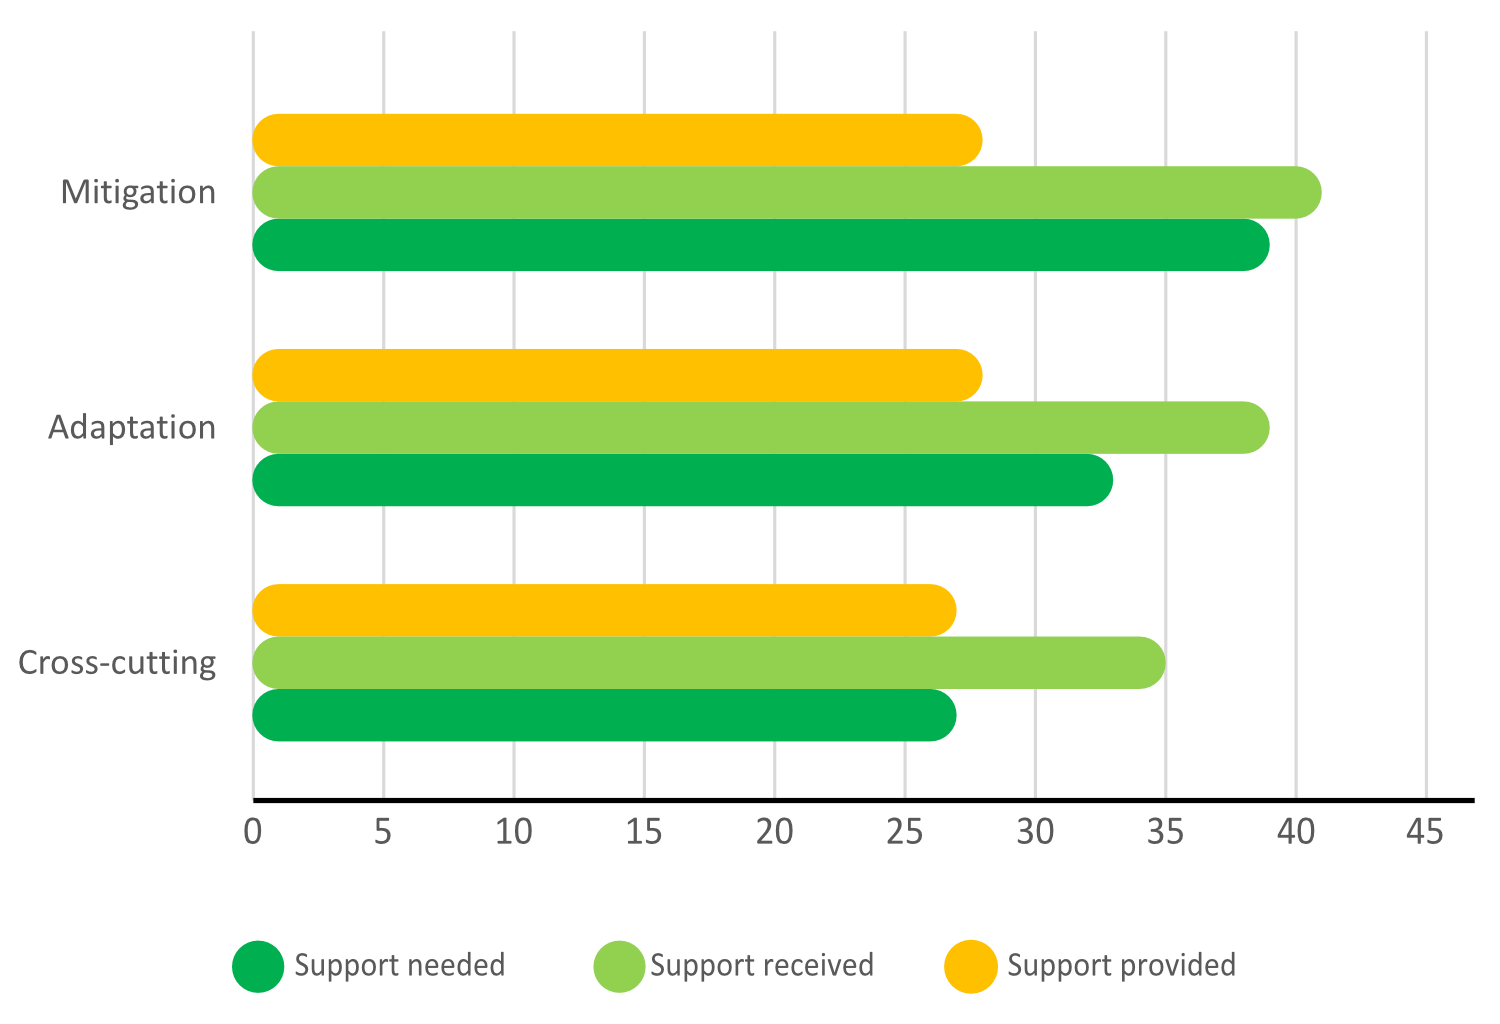
Information on technology development and transfer support appears in 92 per cent of BTR1s, covering 3,410 reported activities or measures (see figure 18). Sectoral priorities for technology support broadly align with those in the latest NDCs, and mitigation-related support is reported by more Parties than adaptation-related support (see figure 19). Reported measures and activities focused mainly on hardware and infrastructure for climate technology development and transfer, and on institutional strengthening. A total of 31 Parties indicated that their identified needs for technology development and transfer support were informed by technology needs assessments (TNAs), while 12 reported a need to update, complete or undertake the TNA process. Bilateral channels accounted for 80 per cent of reported support provided, and support received went primarily to public-sector entities. Private-sector involvement as a recipient remained limited, although 50 per cent of Parties reporting support provided highlighted the private sector’s role in advancing technology development and transfer.
Figure 18. Regional distribution of the reported information on activities and measures relating to technology development and transfer support provided, needed and received in BTR1s, by activity
Credit: UN Climate Change
Figure 19. Parties that reported information on technology development and transfer support provided, needed and received across activities focused on mitigation, adaptation and cross-cutting issues in BTR1s, by Party
Credit: UN Climate Change
Capacity-building support
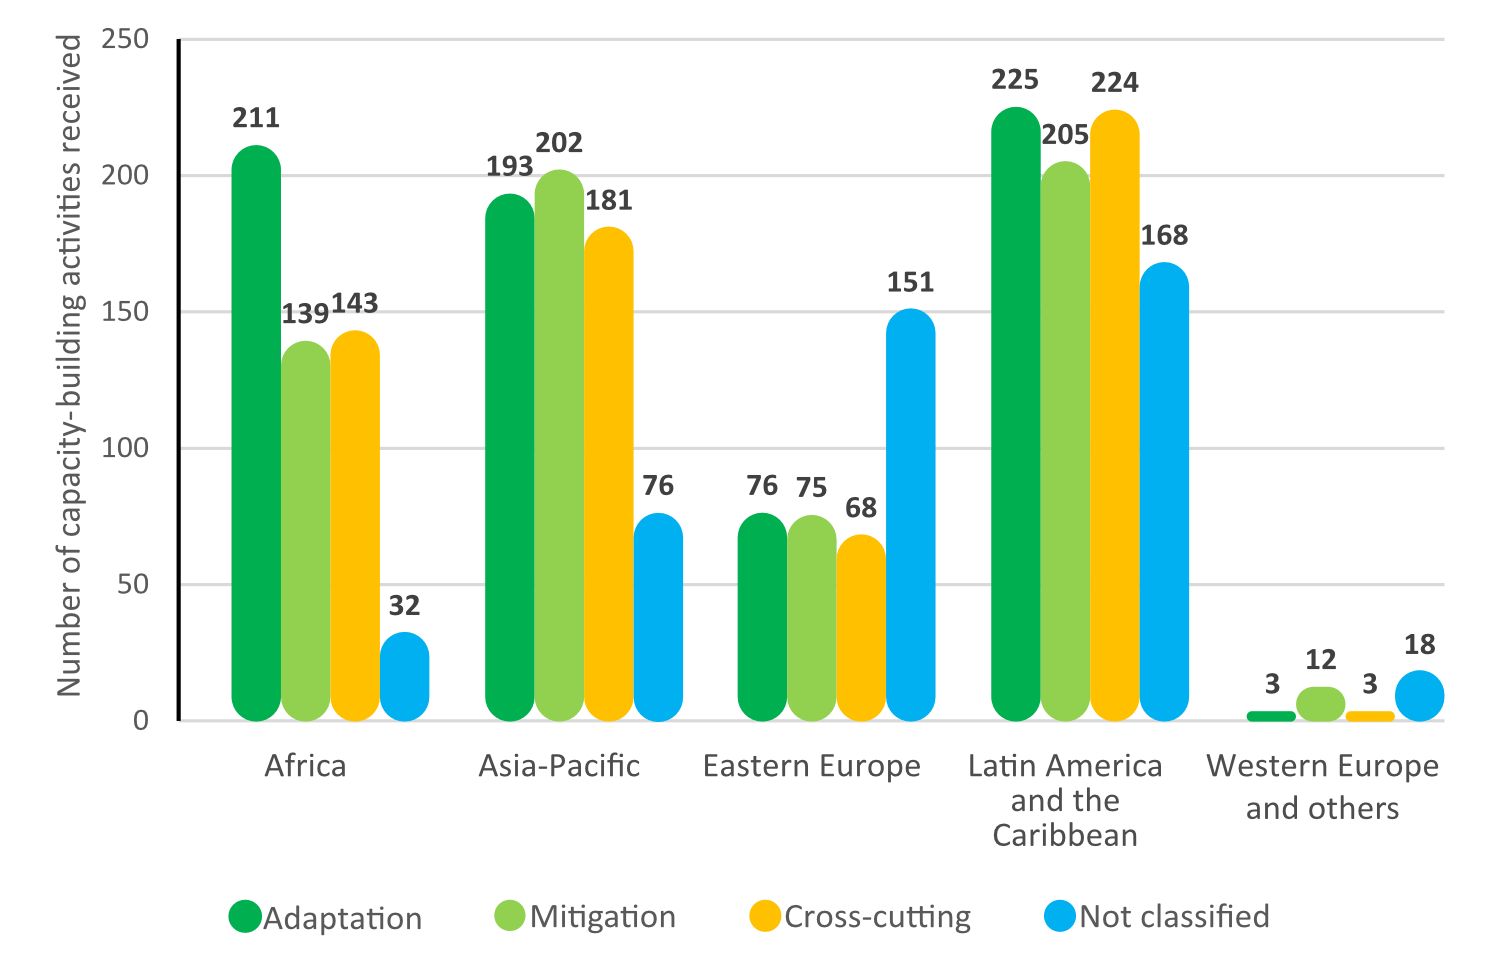
Information on capacity-building support appears in 82.6 per cent of BTR1s: 42 Parties reported support provided, 75 reported support received, including three that reported both. A total of 8,563 capacity-building activities were reported as support provided, focusing primarily on adaptation (61.1 per cent), followed by cross-cutting areas (20.7 per cent) and mitigation (18.2 per cent). Africa (31.7 per cent), Asia and the Pacific (21.7 per cent) and Latin America and the Caribbean (15.6 per cent) were the main destinations of this support, of which 54.1 per cent of activities were completed and 43.8 per cent were ongoing. A total of 69 Parties reported 1,850 capacity-building needs, mainly related to adaptation (39.5 per cent), mitigation (30.2 per cent) and cross-cutting areas (22.5 per cent), including institutional readiness, climate finance, technology deployment, transparency systems, loss and damage, and carbon markets. A further 53 Parties reported transparency-related needs. Seventy-five Parties reported capacity-building support received, covering 2,405 activities across adaptation (29.4 per cent), mitigation (26.3 per cent) and cross-cutting areas (25.7 per cent); 18.6 per cent of activities were not classified. Latin America and the Caribbean reported the largest number of activities received (822), followed by Asia and the Pacific (652) and Africa (525) (see figure 20). Support commonly focused on technical training, institutional strengthening, climate finance readiness, renewable energy and ETF-related transparency capacities, including preparation of BTRs and NIRs, GHG inventory systems and quality assurance and quality control.
Figure 20. Capacity-building activities received, by region and area
Credit: UN Climate Change