This version of the NDC synthesis report synthesizes information from the 166 latest available NDCs, representing 193 Parties to the Paris Agreement, including the 142 new or updated NDCs communicated by 169 Parties, recorded in the NDC registry as at 23 September 2022. A total of 39 Parties have communicated new or updated NDCs since 12 October 2021 (the cut-off date for submissions covered in the previous version of this report), 24 of which after COP 26.
Nationally Determined Contributions – or NDCs - form the basis for countries to achieve the objectives of the Paris Agreement. They contain information on targets, and policies and measures for reducing national emissions and on adapting to climate change impacts. NDCs also contain information on either the needs for, or the provision of, finance, technologies and capacity building for these actions. Countries communicate new or updated NDCs every five years starting in 2020.
This version of the NDC synthesis report synthesizes information from the 166 latest available NDCs, representing 193 Parties to the Paris Agreement, including the 142 new or updated NDCs communicated by 169 Parties, recorded in the NDC registry as at 23 September 2022, covering 94.9 per cent of the total global emissions in 2019, which are estimated at 52.6 Gt CO2 eq without LULUCF. A total of 39 Parties have communicated new or updated NDCs since 12 October 2021 (the cut-off date for submissions covered in the previous version of this report), 24 of which after COP 26.
The COP and CMA guidance on the information necessary for clarity, transparency and understanding of NDCs was used as a framework for synthesizing the relevant information contained in the communicated NDCs, which was supplemented by the synthesis of other information included in the NDCs but not covered by the guidance. The synthesized information is presented for all the represented Parties taken together.
Almost all Parties (95 per cent) provided the information necessary to facilitate clarity, transparency and understanding of their NDCs in accordance with the COP guidance, with almost all Parties (94 per cent) that submitted new or updated NDCs already applying the relevant further CMA guidance.
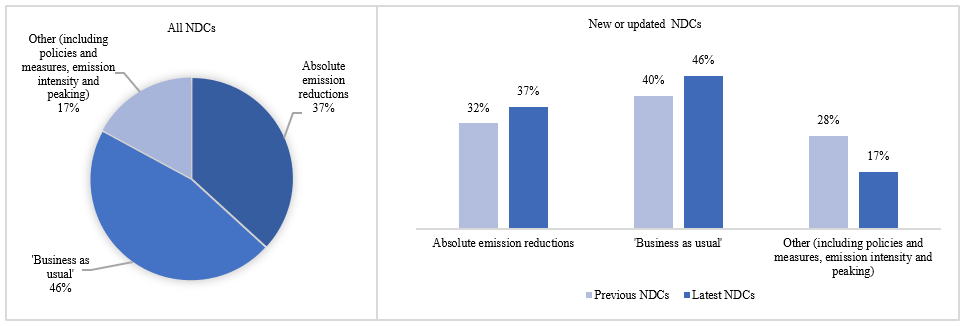
All Parties provided information on mitigation targets or mitigation co-benefits resulting from adaptation actions and/or economic diversification plans. The mitigation targets range from economy-wide absolute emission reduction targets to strategies, policies, plans and actions for low-emission development. In their NDCs:
Most Parties (90 per cent) provided quantified mitigation targets, expressed as clear numerical targets, while the rest (10 per cent) included strategies, policies, plans and actions for which there is no quantifiable information as components of their NDCs;
Most Parties (80 per cent) communicated economy-wide targets, covering all or almost all sectors defined in the 2006 IPCC Guidelines, with an increasing number of Parties moving to absolute emission reduction targets in their new or updated NDCs;
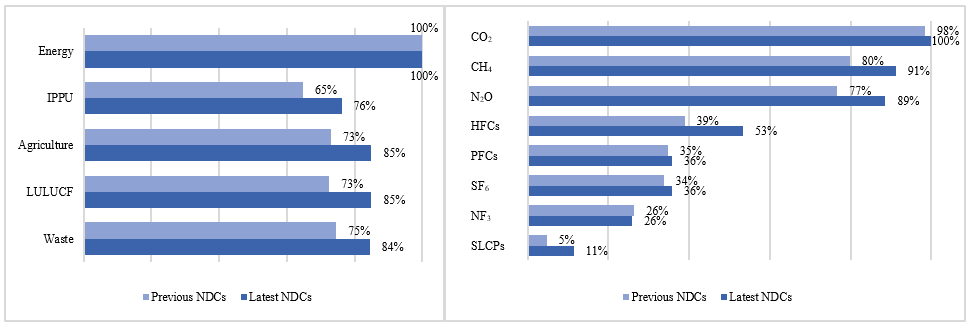
In terms of GHGs, all NDCs cover CO2 emissions, most cover CH4 (91 per cent) and N2O (89 per cent) emissions, many (53 per cent) cover HFC emissions and some cover PFC and SF6 (36 per cent) and NF3 (26 per cent) emissions;
Many Parties (50 per cent) provided information on mitigation co-benefits resulting from their adaptation actions and/or economic diversification plans, mostly in combination with other targets;
Most of the Parties (74 per cent) that submitted new or updated NDCs have strengthened their commitment to reducing or limiting GHG emissions by 2025 and/or 2030, demonstrating increased ambition in addressing climate change.
Credit: UN Climate Change
Types of mitigation target and share of Parties that communicated them in nationally determined contributions
Credit: UN Climate Change
Sectors and greenhouse gases covered by Parties that communicated them in nationally determined contributions
Almost all Parties (92 per cent) communicated an NDC implementation period of until 2030, while a few (8 per cent) specified an implementation period of until 2025, 2035, 2040 or 2050. Many Parties (55 per cent) identified 1 January 2021 as their starting date for NDC implementation; some others (31 per cent) indicated that they started implementing their NDC in or before 2020; and a few Parties (3 per cent) mentioned starting implementation in 2022.
Almost all Parties (93 per cent) provided quantified information on their mitigation targets and reference points. Of the Parties that submitted new or updated NDCs, most (84 per cent) updated the basis for defining their targets, including reference points and/or ‘business as usual’ scenarios. Such updates lead to higher-quality NDCs and, for some Parties, to significant changes in the estimated emission levels for 2025 and 2030.
Credit: UN Climate Change
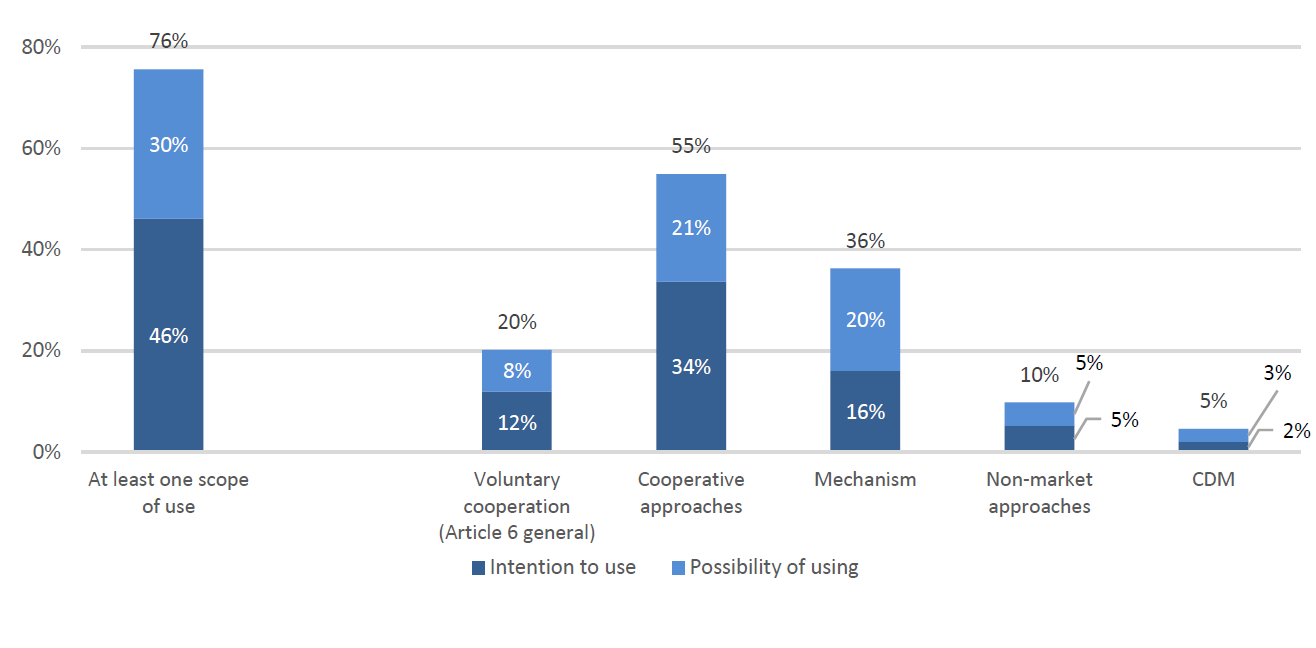
Share of Parties indicating in nationally determined contributions the intention to use or possibility of using specific scopes of voluntary cooperation
Most Parties (81 per cent) provided information on voluntary cooperation under Article 6 of the Paris Agreement. Almost all of them (76 per cent) stated that they plan to or will possibly use at least one type of voluntary cooperation, with the use of cooperative approaches most frequently communicated. At the same time, some Parties (30 per cent) have set qualitative limits on their use of voluntary cooperation for achieving their mitigation targets, such as using units that adhere to certain standards and guidelines to ensure, for example, additionality, permanence or avoidance of double counting of emission reductions.
Of the Parties that communicated new or updated NDCs, the share that indicated planned or possible use of at least one type of voluntary cooperation has increased from 49 to 82 per cent since their previous NDCs. Similarly, the share of those Parties that have set qualitative limits on their use of voluntary cooperation has sharply increased from 19 to 32 per cent since their previous NDCs.
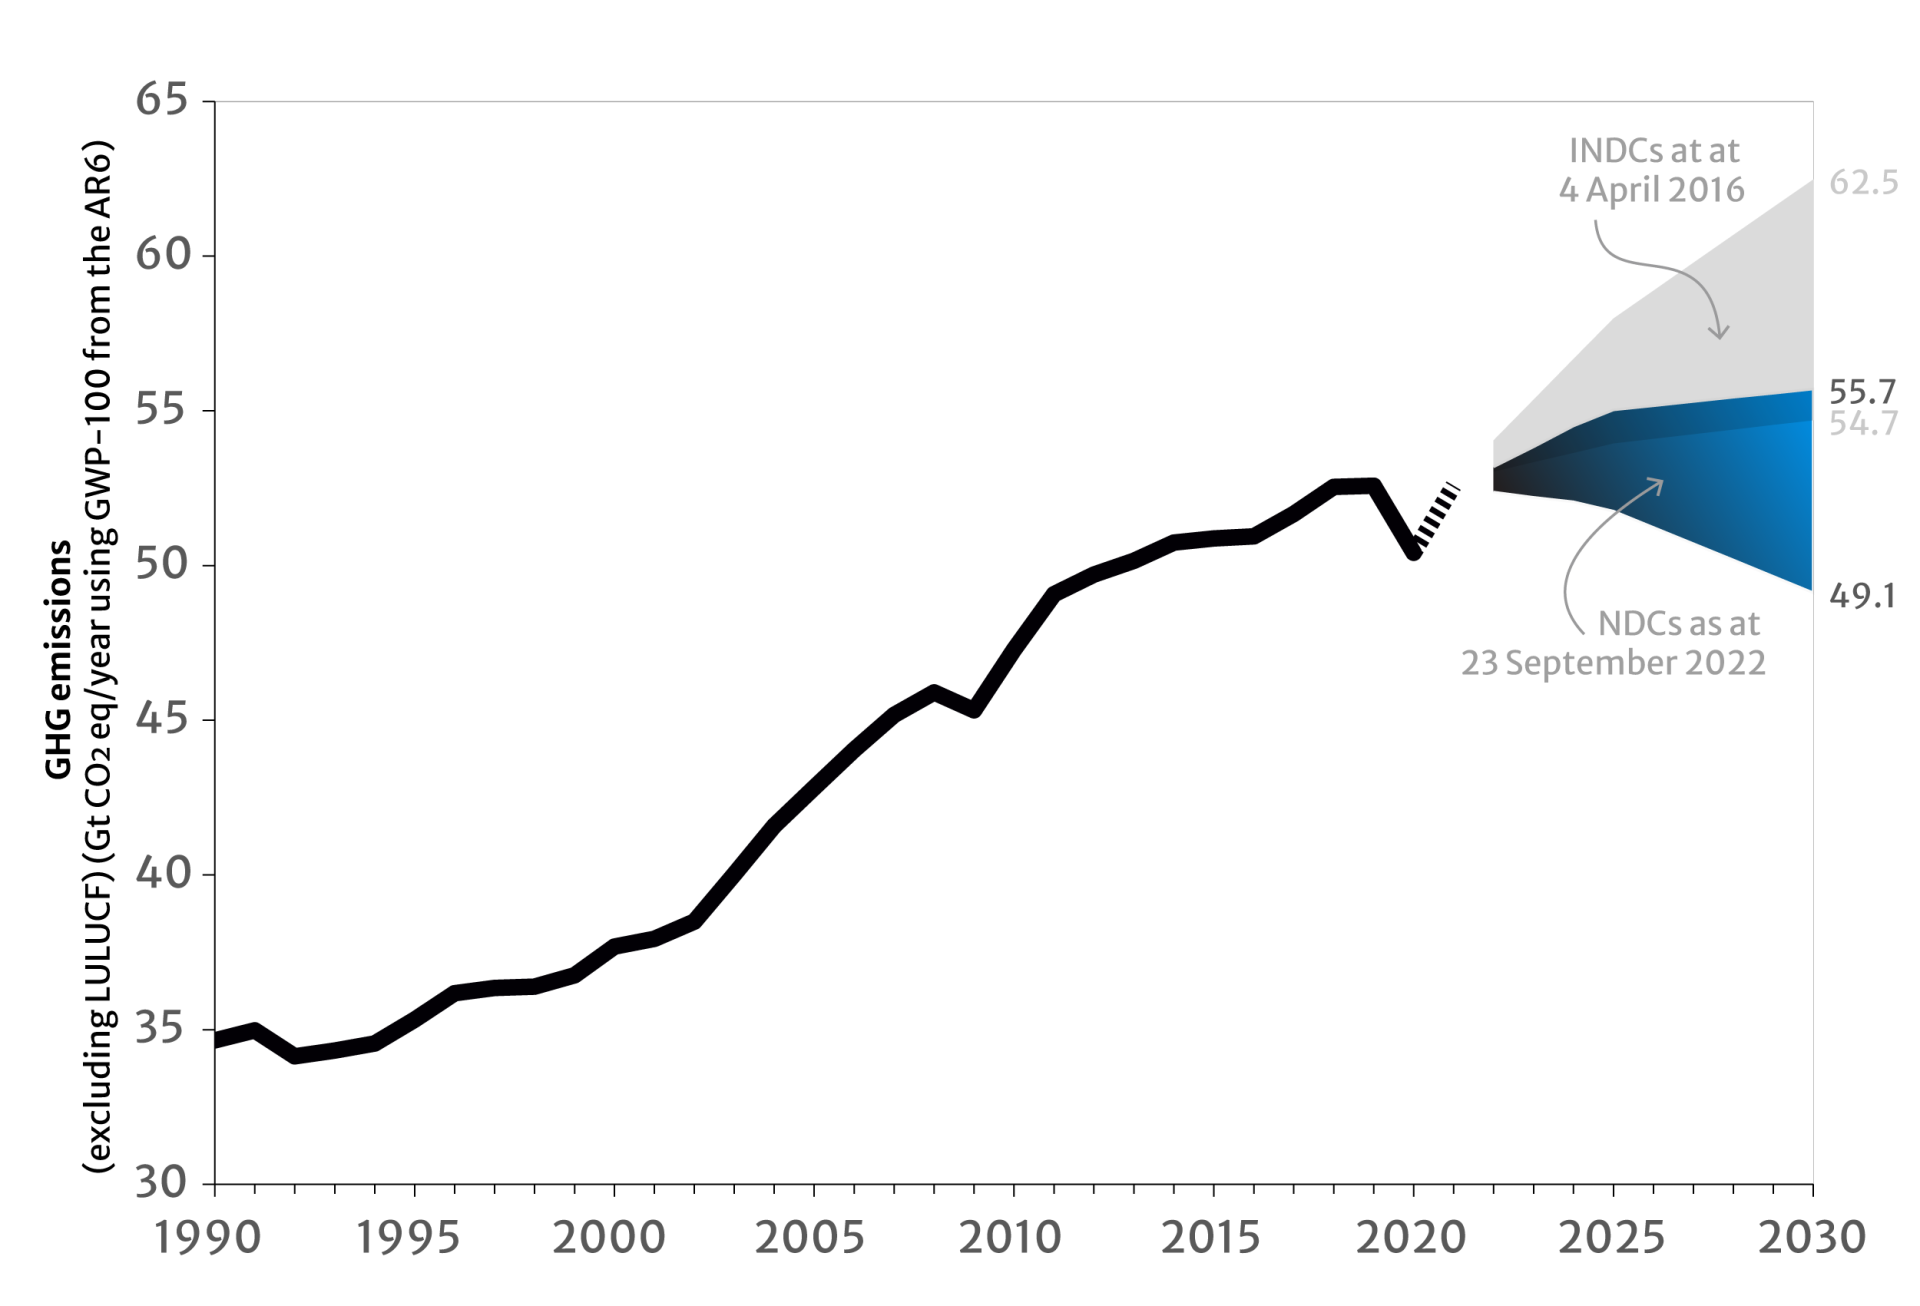
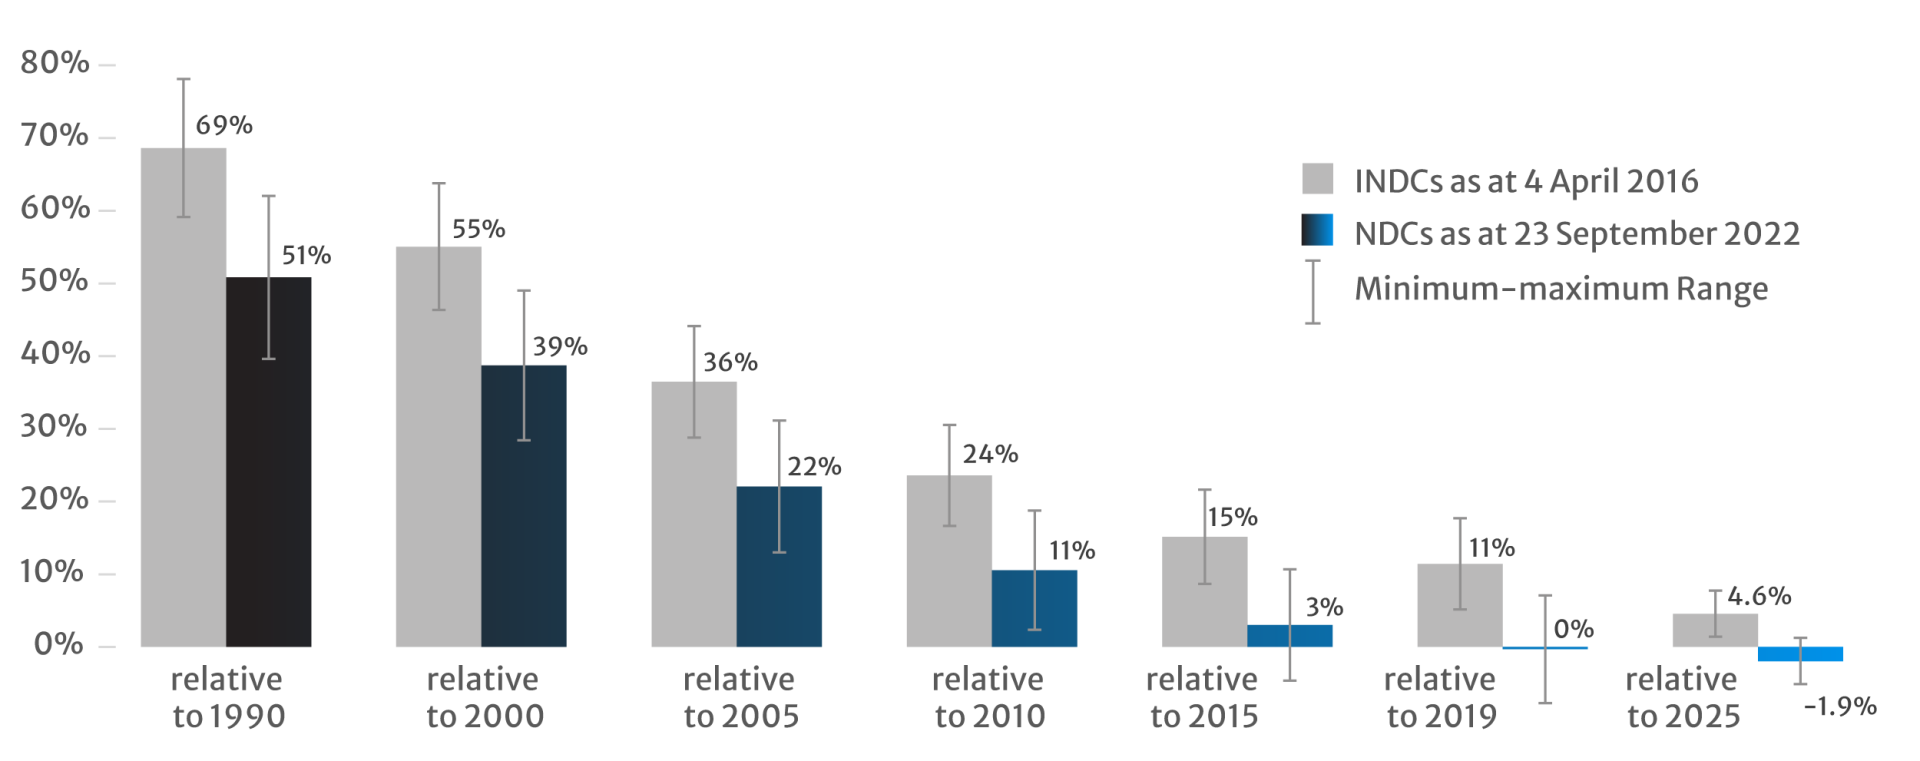
Total global GHG emissions (without LULUCF) taking into account implementation of the latest NDCs are estimated to be around 53.4 (51.8–55.0) Gt CO2 eq in 2025 and 52.4 (49.1–55.7) Gt CO2 eq in 2030, which are:
In 2025, 53.7 per cent higher than in 1990 (34.7 Gt CO2 eq), 12.6 per cent higher than in 2010 (47.4 Gt CO2 eq) and 1.6 per cent higher than in 2019 (52.6 Gt CO2 eq);
In 2030, 50.8 per cent higher than in 1990, 10.6 per cent higher than in 2010 and 0.3 per cent lower than in 2019, as well as 1.9 per cent lower than the estimated level for 2025, indicating the possibility of global emissions peaking before 2030.
Credit: UN Climate Change
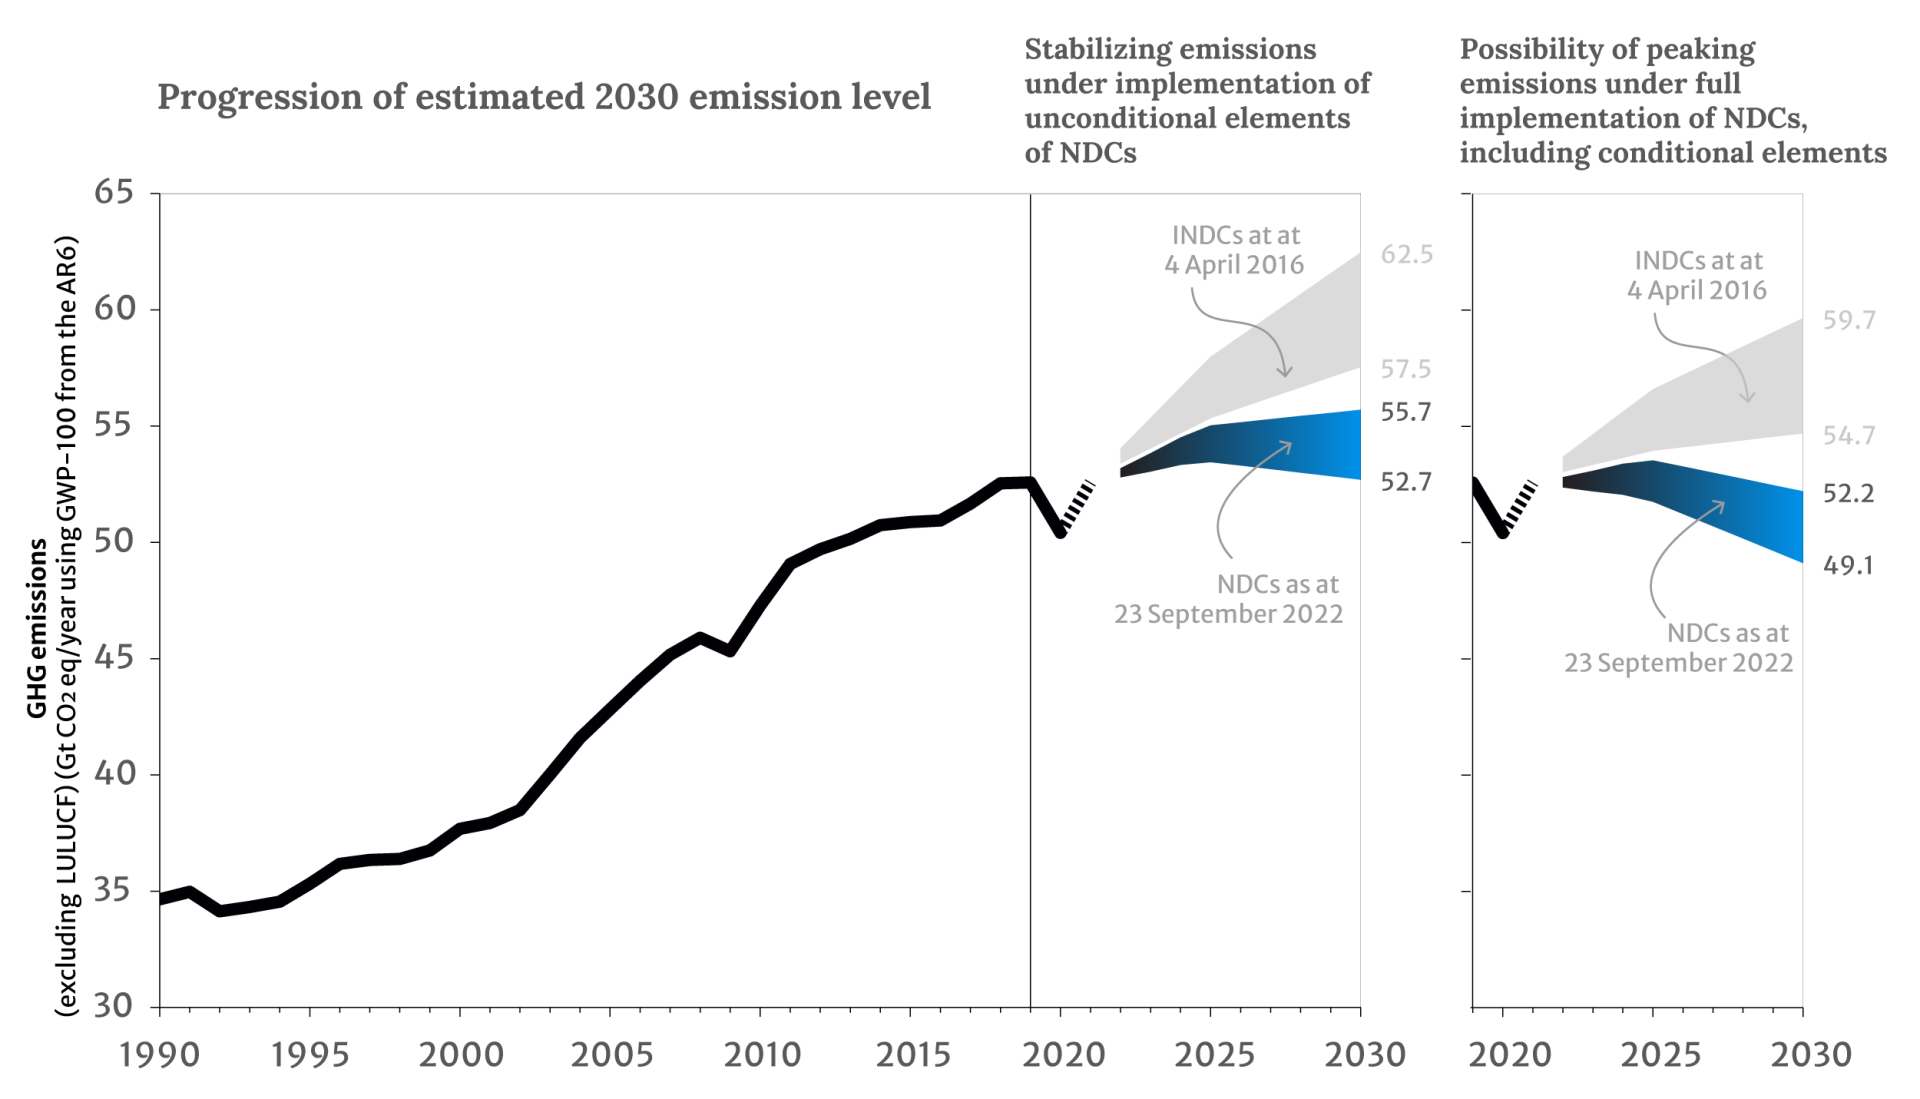
Projected range and progression of emission levels according to nationally determined contributions
In comparison, the total GHG emissions of the Parties that communicated new or updated NDCs are estimated at 45.6 Gt CO2 eq for 2019, and the total GHG emission levels resulting from implementation of their NDCs are estimated to be around 46.4 (44.9–47.8) Gt CO2 eq in 2025 and 45.6 (42.7–48.6) Gt CO2 eq in 2030. These emission levels are about 3.8 (3.3–4.3) per cent lower for 2025 and 9.5 (9.2–9.7) per cent lower for 2030 than the estimated levels for these years according to their previous NDCs. In absolute terms, the projected emission levels for 2025 and 2030 for this group of Parties are now lower than according to their previous NDCs by 1.8 (1.5–2.1) Gt CO2 eq and 4.8 (4.3–5.2) Gt CO2 eq respectively. Compared with the 2010 level, total GHG emissions of these Parties are estimated to be 12.3 (8.8–15.9) per cent higher by 2025 and 10.5 (3.4–17.6) per cent higher by 2030; while, compared with the 2019 level, their total GHG emissions are estimated to be 1.6 per cent higher (with a range from 1.6 per cent lower to 4.8 per cent higher) by 2025 and approximately the same as in 2019 (with a range from 6.5 per cent lower to 6.4 per cent higher) by 2030.
In comparison, the total GHG emission levels resulting from implementation of the NDCs presented in the previous version of this report were estimated to be around 54.7 (52.7–56.7) Gt CO2 eq in 2025 and 54.9 (51.5–58.3) Gt CO2 eq in 2030, which are about 2.4 (1.8–3.0) and 4.7 (4.8–4.7) per cent higher for 2025 and 2030 respectively than the estimated emission levels indicated in this version of the report.
The projected total global GHG emission level taking into account full implementation of all latest NDCs (including all conditional elements) implies an even stronger possibility of global emissions peaking before 2030 than estimated in the previous version of this report, with the lower bound of the 2030 emission level (49.1 Gt CO2 eq) estimated to be up to 6.6 per cent below the 2019 emission level (52.6 Gt CO2 eq) and 5.1 per cent below the lower bound of the estimated 2025 emission level (51.8 Gt CO2 eq). However, in order to achieve that peaking, the conditional elements of the NDCs need to be implemented, which depends mostly on access to enhanced financial resources, technology transfer and technical cooperation, and capacity-building support; availability of market-based mechanisms; and absorptive capacity of forests and other ecosystems.
Credit: UN Climate Change
Projected total emission level in 2030 according to nationally determined contributions compared with historical levels and estimated 2025 level
The total global GHG emission level in 2030 taking into account implementation of all latest NDCs is estimated to be 10.6 (3.6–17.5) per cent above the 2010 level and 0.3 per cent below the 2019 level (with a range from 6.6 per cent below to 6.0 per cent above), which is lower than the level for 2030 presented in the previous version of this report (15.9 per cent above the 2010 level and 4.7 above the 2019 level). This shows that Parties to the Paris Agreement are increasing the ambition of their climate action in accordance with Article 4, paragraphs 3 and 11, of the Paris Agreement and in response to the relevant call in the Glasgow Climate Pact.
Credit: UN Climate Change
Historical and projected total global emissions according to nationally determined contributions
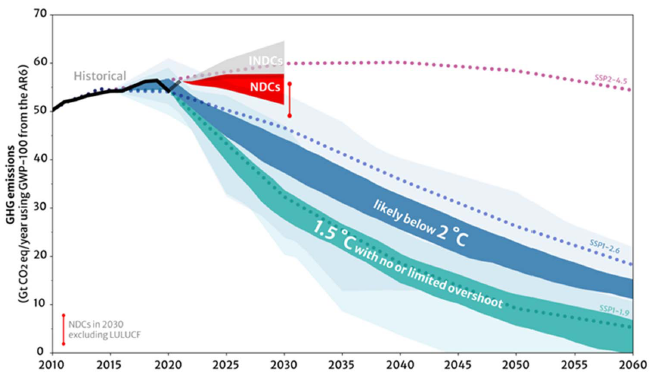
The contribution of Working Group III to the AR6 concludes that, in scenarios of limiting warming to 1.5 °C (with over 50 per cent likelihood by 2100) with no or limited overshoot, GHG emissions are reduced by 43 (34–60) per cent by 2030 relative to the 2019 level. For the subgroup of scenarios in which net zero emissions are also achieved in line with Article 4, paragraph 1, of the Paris Agreement, the emission reductions are slightly less, at 41 (31–59) per cent by 2030; and for the subgroup of scenarios in which net zero emissions are not achieved this century, the near-term emission reductions by 2030 tend to be slightly stronger, at 48 (35–61) per cent. In scenarios of keeping warming likely below 2 °C (with over 67 per cent likelihood) with mitigation action starting in 2020, emissions in 2030 are 27 (13–45) per cent below the 2019 level.
Full implementation of all latest NDCs (including all conditional elements) is estimated to lead to a 3.6 (0.7–6.6) per cent emission reduction by 2030 relative to the 2019 level; while implementation of all latest NDCs excluding any conditional elements is estimated to result in 3.1 (0.2–6.0) per cent higher emissions in 2030 than in 2019.
The absolute difference in the level of emissions by 2030 according to the latest NDCs and these IPCC scenarios is sizeable, despite progress compared with the level according to the INDCs as at 4 April 2016. The difference between the projected emission levels that do not take into account implementation of any conditional elements of NDCs and the emission levels in the scenarios of keeping warming likely below 2 °C (with over 67 per cent likelihood) by 2030 is estimated to be 16.0 (12.0–19.4) Gt CO2 eq. In relation to the scenarios of limiting warming to 1.5 °C (with over 50 per cent likelihood) and achieving net zero emissions this century, the gap is even wider, at an estimated 23.9 (22.2–28.8) Gt CO2 eq. However, assuming full implementation of all latest NDCs, including all conditional elements, the gap is slightly narrowed, towards 12.5 (8.5–15.9) Gt CO2 eq in relation to the aforementioned 2 °C scenarios and towards 20.3 (18.7–25.3) Gt CO2 eq in relation to the aforementioned 1.5 °C scenarios.
Credit: UN Climate Change
Comparison of scenarios assessed in the Intergovernmental Panel on Climate Change Sixth Assessment Report with projected total and per capita global emissions according to nationally determined contributions
Taking into account implementation of NDCs up until 2030, projected global mean temperatures are subject to significant uncertainty owing to the range of emission levels estimated for 2030 resulting from implementation of NDCs (including whether conditional elements are implemented or not), the range of illustrative emission extensions beyond 2030 and inherent climate system uncertainties. The best estimate of peak temperature in the twenty-first century (projected mostly for 2100 when temperature continues to rise) is in the range of 2.1–2.9 °C depending on the underlying assumptions.
In the context of the carbon budget consistent with 50 per cent likelihood of limiting warming to 1.5 °C (500 Gt CO2), cumulative CO2 emissions in 2020–2030 based on the latest NDCs would likely use up 86 per cent of the remaining carbon budget, leaving a post-2030 carbon budget of around 70 Gt CO2, which is equivalent to approximately two years of projected total global CO2 emissions by 2030. Similarly, in the context of the carbon budget consistent with a likely chance of keeping warming below 2 °C (estimated by the IPCC to be 1,150 Gt CO2 from 2020 onward), cumulative CO2 emissions in 2020–2030 based on the latest NDCs would likely use up around 37 per cent of the remaining carbon budget. For comparison, total global CO2 emissions between 1850 and 2020 are estimated by the IPCC to have amounted to 2,390 (2,150–2,630) Gt CO2.
The information above implies, despite some progress since the previous version of this report, an urgent need for either a significant increase in the level of ambition of NDCs between now and 2030 or a significant overachievement of the latest NDCs, or a combination of both, in order to attain the cost-effective emission levels suggested in many of the scenarios considered by the IPCC for keeping warming likely below 2 °C or limiting it to 1.5 °C. If emissions are not reduced by 2030, they will need to be substantially reduced thereafter to compensate for the slow start on the path to net zero emissions. The AR6 identifies net zero CO2 emissions as a prerequisite for halting warming at any level.
Many Parties (44 per cent) provided information on long-term mitigation visions, strategies and targets for up until and beyond 2050. Their total GHG emission level is estimated to be 36.6 (34.9–38.4) Gt CO2 eq in 2030, which is 2 per cent (with a range from 3 per cent lower to 7 per cent higher) higher than their 2010 emission level and 6 (2–11) per cent lower than their 2019 emission level.
Mindful of the inherent uncertainty of such long-term estimates, the information indicates that these Parties’ total GHG emission level could be 64 (59–69) per cent lower in 2050 than in 2019 and their annual per capita emissions would be 2.4 (2.1–2.7) t CO2 eq by 2050. Under scenarios of limiting warming to likely below 2 °C (with over 67 per cent likelihood), annual per capita emissions are 2.2 (1.4–2.9) t CO2 eq; hence the estimated long-term per capita emissions of these Parties are at a level consistent with 2 °C scenarios. However, for scenarios of limiting warming to 1.5 °C (with 50 per cent likelihood by 2100) and achieving net zero emissions this century, annual per capita emissions by 2050 are required to be two to three times lower, at 0.9 (0.0–1.6) t CO2 eq.
Almost all Parties (97 per cent) explained their approach to NDC preparation and implementation. Many (57 per cent) linked their NDCs to their commitment to transitioning to a sustainable and/or low-carbon and resilient economy, taking into account social, environmental and economic factors as well as the SDGs. In addition, many Parties (46 per cent) indicated that they have integrated their NDC targets, goals and policies into national legislative, regulatory and planning processes as a means of ensuring implementation.
Many Parties (64 per cent) highlighted policy coherence and synergies between their domestic mitigation measures and development priorities, which include the SDGs and, for some that submitted new or updated NDCs, LT-LEDS and green recovery from the coronavirus disease 2019 pandemic.
Most Parties (79 per cent) referred to formal arrangements in place for domestic stakeholder consultation. Almost all of those Parties (93 per cent) indicated that they conducted consultations and engagement in an inclusive and participatory manner. Many of those Parties (60 per cent) specifically referenced gender-sensitive consultations.
Parties are increasingly recognizing gender integration as a means to enhance the ambition and effectiveness of their climate action. Most Parties (75 per cent) provided information related to gender in their NDCs and some (39 per cent) affirmed that they will take gender into account in implementing them. Of the Parties that referenced gender in their previous NDCs, some (20 per cent) elaborated more on the topic in their new or updated NDCs. Some (38 per cent) included information on how gender had been or was planned to be mainstreamed in NDC implementation.
Credit: UN Climate Change
Reference to gender in nationally determined contributions
Some Parties (29 per cent) described the role of local communities and the role, situation and rights of indigenous peoples in the context of their NDCs, describing the specific vulnerabilities of indigenous peoples that are particular to their circumstances, the importance of drawing on indigenous and local knowledge to strengthen climate efforts, and arrangements to enable greater participation in and contributions to climate action by indigenous peoples.
Almost all Parties (97 per cent) provided information on using one or more ACE elements to promote implementation of mitigation and adaptation activities, and in their new or updated NDCs Parties generally communicated more clearly and in more detail on general principles, past achievements, future commitments, and needs and gaps in relation to ACE.
Most Parties (80 per cent) included an adaptation component in their NDC and some of the adaptation components (13 per cent) were designated as adaptation communications. Parties provided information in particular on adaptation-related research; vulnerabilities; adaptation measures, in particular NAPs and sectoral actions; contingency measures; synergies with mitigation and other global frameworks; and monitoring and evaluation of adaptation.
In comparison with Parties’ previous NDCs, more of the NDCs contain adaptation information. The adaptation components of the NDCs, where included, indicate increased focus on national adaptation planning, in particular on the process to formulate and implement NAPs. The new or updated NDCs include, in comparison with the same Parties’ previous NDCs, more information on time-bound quantitative adaptation targets and the associated indicator frameworks, more specific links between adaptation efforts and efforts towards the SDGs, and more specific information on synergies and co-benefits between adaptation and mitigation.
Credit: UN Climate Change
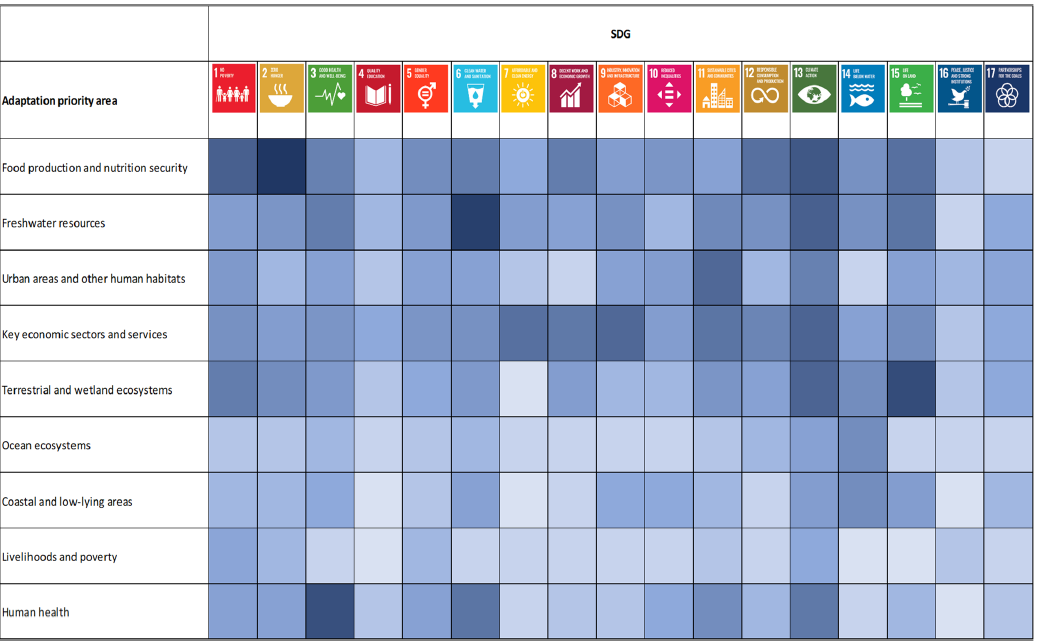
Synergies between efforts in adaptation priority areas and efforts towards the Sustainable Development Goals
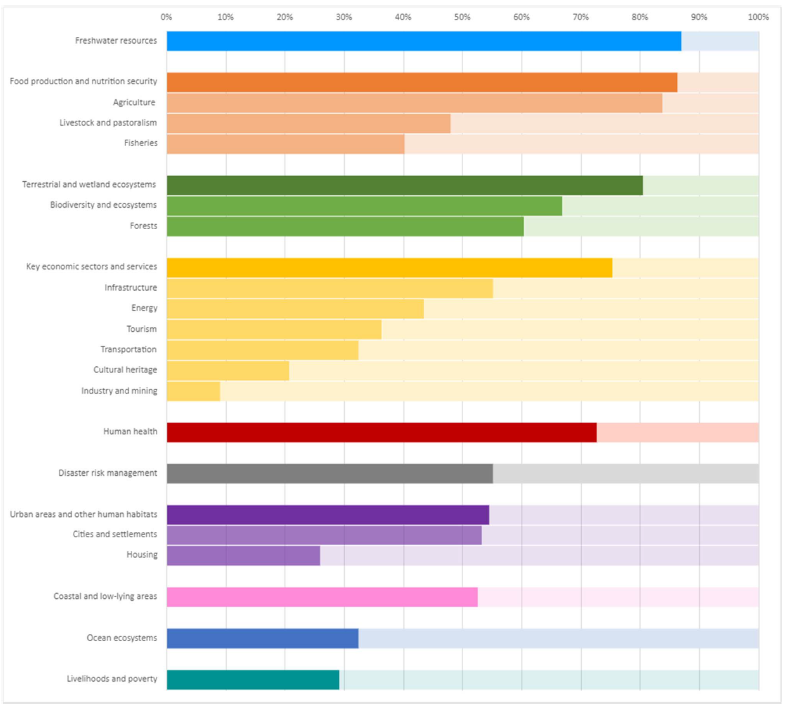
In terms of adaptation priorities, the NDCs illustrate that Parties continue to focus on freshwater resources; food production and nutrition security; terrestrial and wetland ecosystems; key economic sectors and services; human health; disaster risk management; urban areas and human habitats; coastal and low-lying areas; ocean ecosystems; and livelihoods and poverty.
Credit: UN Climate Change
Share of adaptation components of nationally determined contributions referring to specific adaptation priority
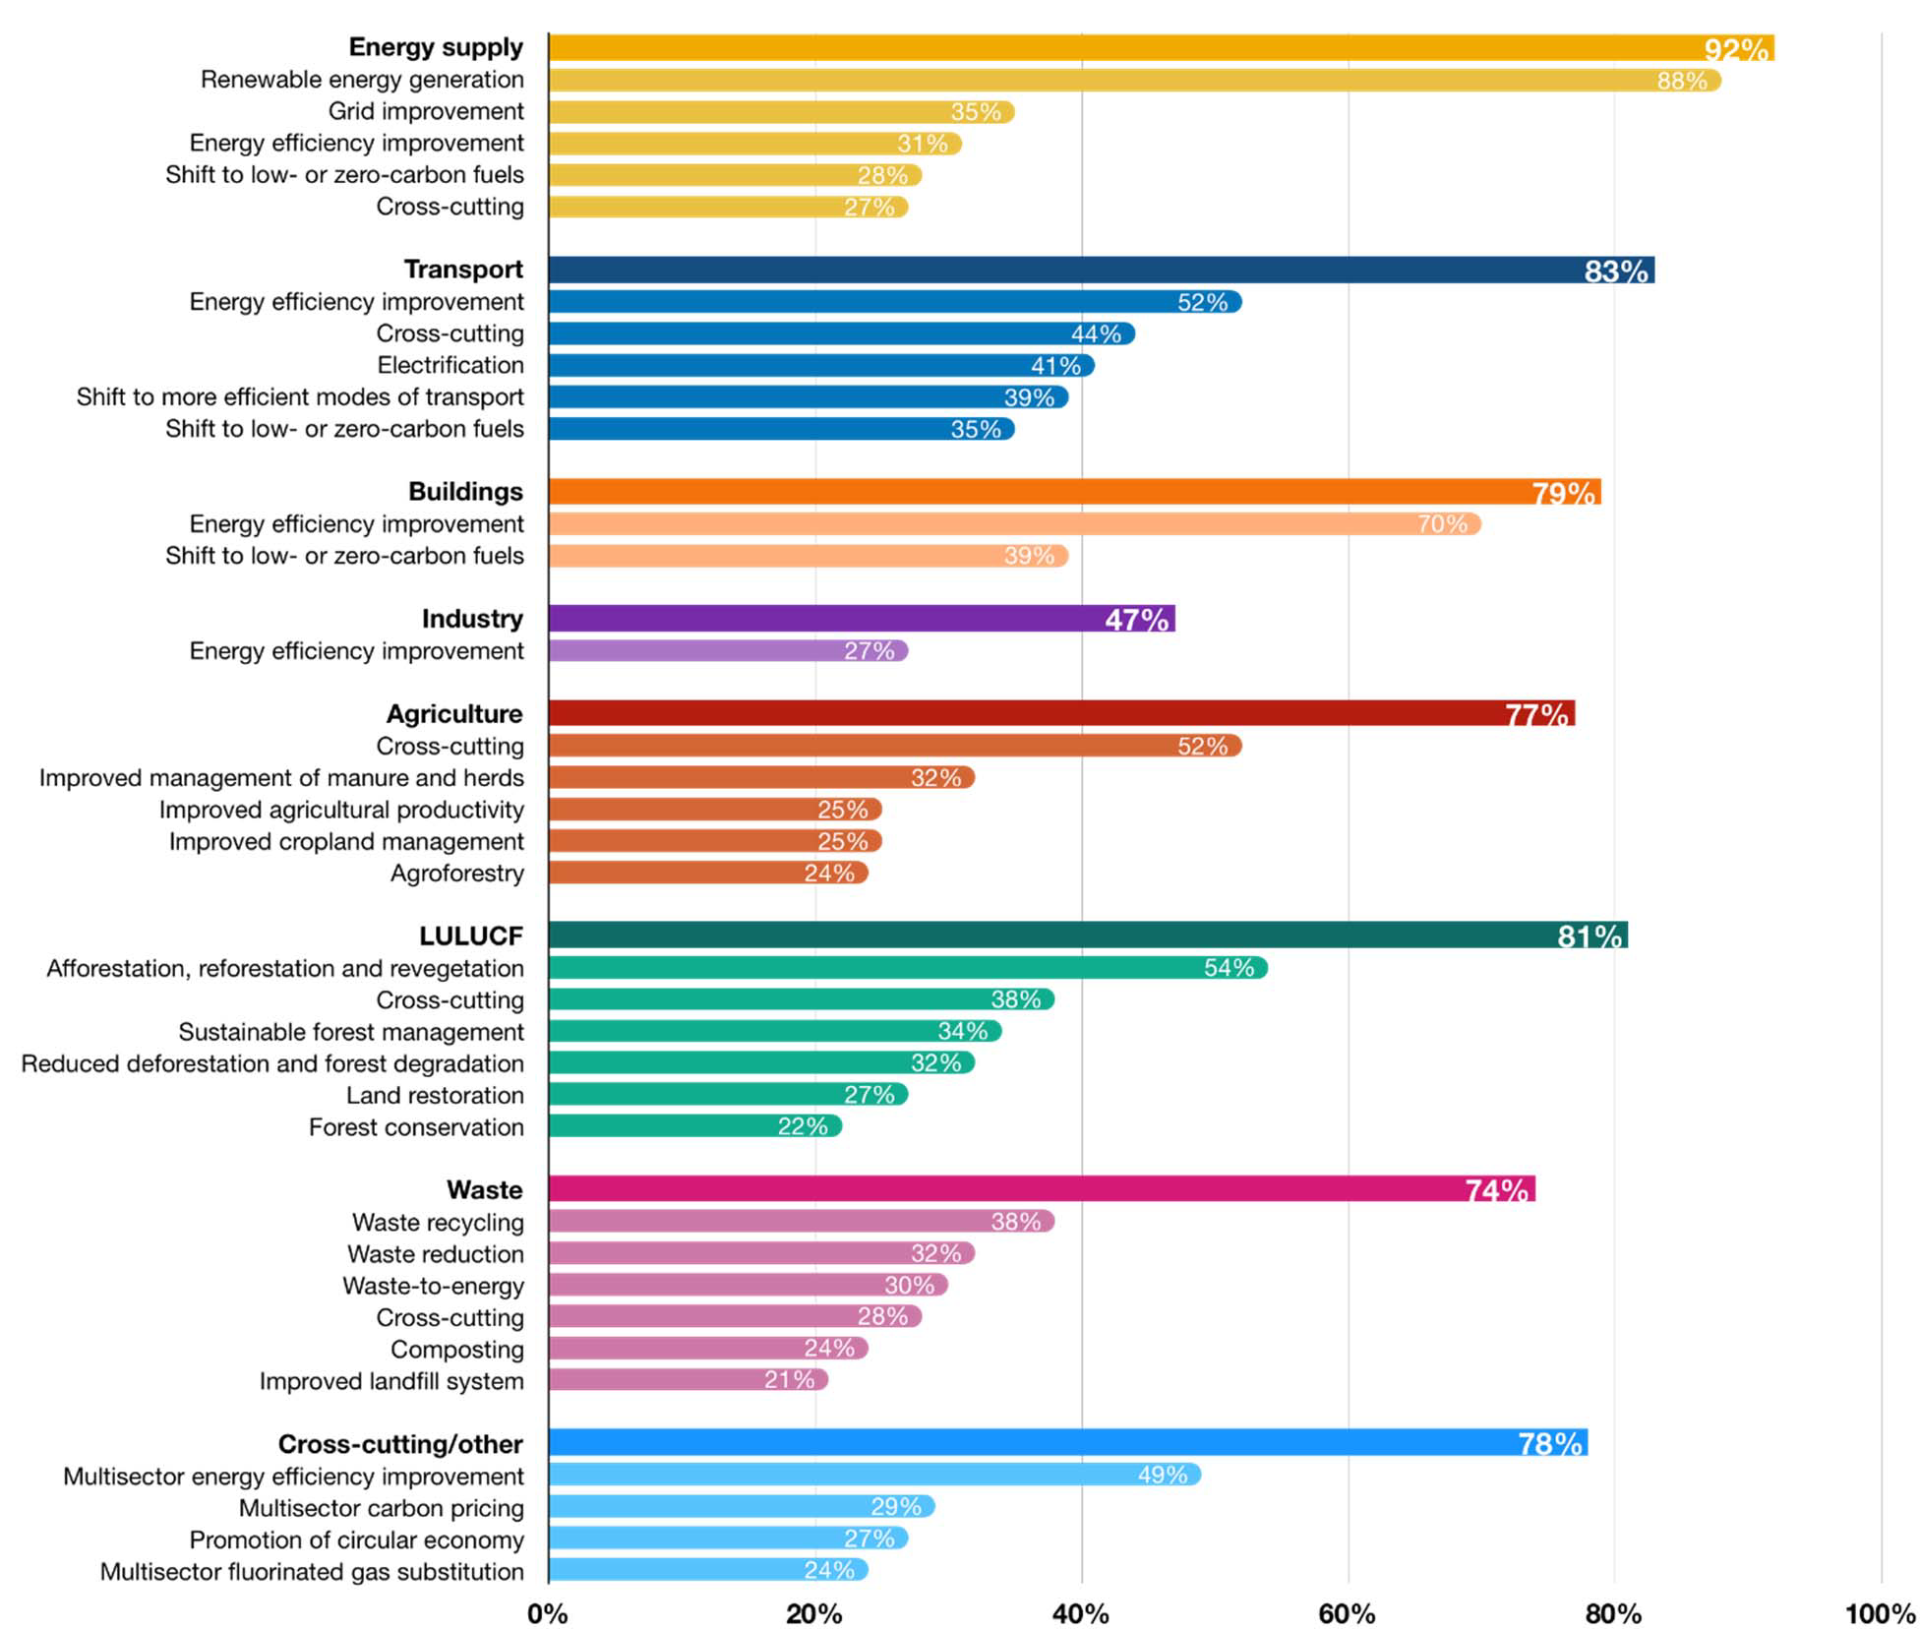
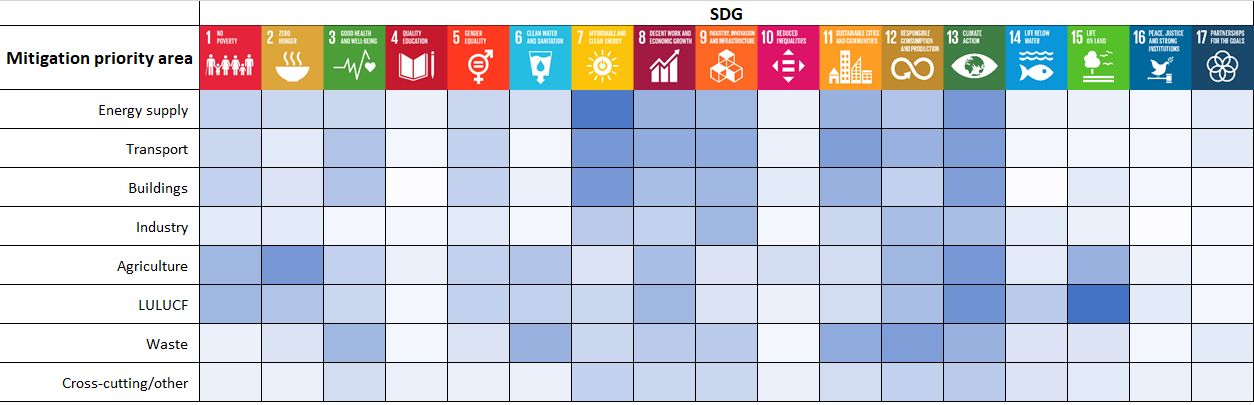
Almost all Parties (97 per cent) outlined domestic mitigation measures as key instruments for achieving mitigation targets for their NDCs and/or for priority areas, such as energy supply, transport, buildings, industry, agriculture, LULUCF and waste. However, Parties indicated measures in industry (47 per cent), the second largest source of global GHG emissions with the second highest annual growth rate of GHG emissions among the priority areas, much less frequently than for other priority areas (74–92 per cent).
Most Parties (74 per cent) communicated one or more quantitative mitigation targets specific to priority areas or sub-areas, which support and underpin their overall mitigation targets. Such quantitative mitigation targets were provided most frequently for energy supply (57 per cent), followed by LULUCF (43 per cent) and cross-cutting or other (42 per cent), and were much less frequently indicated for the other priority areas (5–19 per cent).
Domestic mitigation measures for renewable energy generation (88 per cent) were most frequently mentioned by Parties, followed by measures for improving energy efficiency of buildings (70 per cent) and for afforestation, reforestation and revegetation (54 per cent). Some Parties (21 per cent) communicated quantitative targets for the share (ranging from 15 to 100 per cent) of renewable energy in electricity generation by 2030; and many of those target shares (13 per cent) fall within or above the SR1.5 range of 47–65 per cent consistent with 1.5 °C pathways. For the Parties that communicated new or updated NDCs, renewable energy generation continued, as in their previous NDCs, to be the most frequently indicated mitigation option, with the share of Parties indicating this option sharply increasing since their previous NDCs from 59 to 91 per cent.
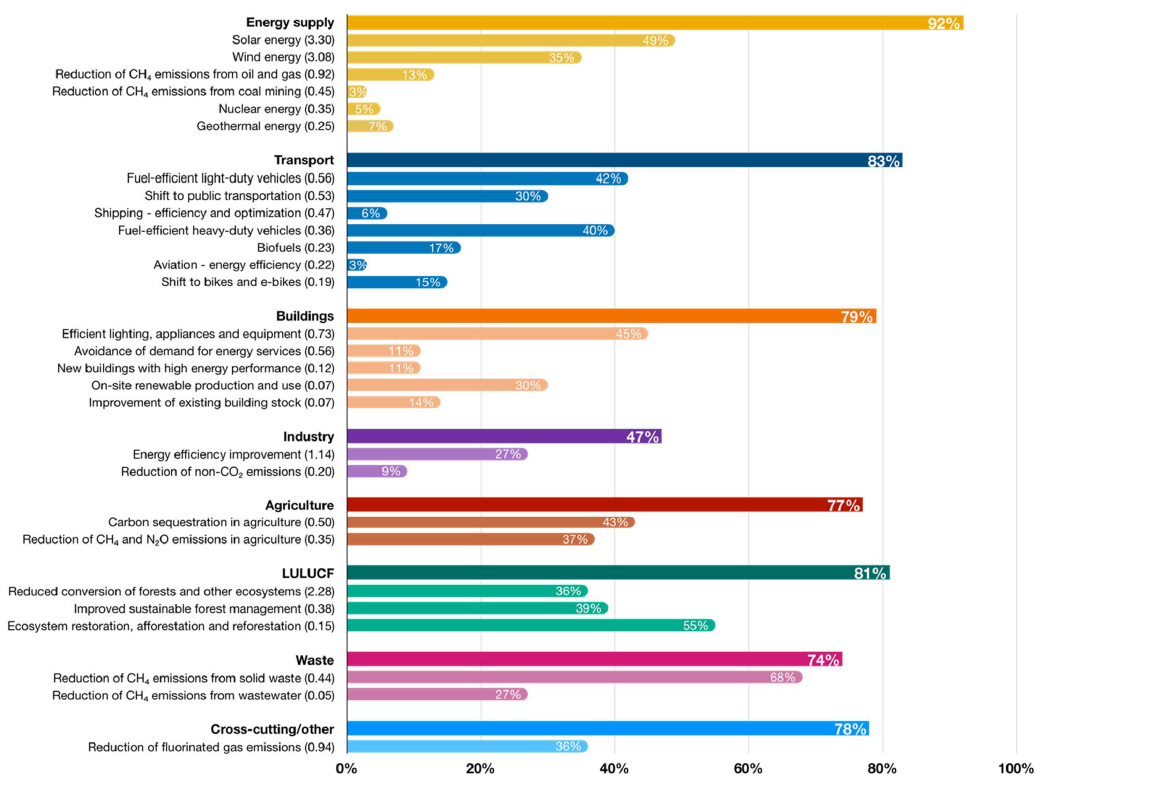
Parties identified mitigation options with high net emission reduction potential costing less than USD 20/t CO2 eq, which are projected in the contribution of Working Group III to the AR6 to account for more than half of the total emission reduction potential required for being on 1.5 °C pathways by 2030, including (with estimated net emission reduction potential indicated in parentheses):
Solar energy (3.3 Gt CO2 eq/year), with many Parties (49 per cent) communicating corresponding measures;
Wind energy (3.08 Gt CO2 eq/year), with some Parties (35 per cent) indicating corresponding measures;
Reduced conversion of forests and other ecosystems (2.28 Gt CO2 eq/year), with some Parties (36 per cent) reporting corresponding measures;
Energy efficiency improvement in industry (1.14 Gt CO2 eq/year), with some Parties (27 per cent) identifying corresponding measures.
Credit: UN Climate Change
Share of Parties referring to mitigation options with high mitigation potential costing below USD 20/t CO2 eq in 2030 in nationally determined contributions
Credit: UN Climate Change
Share of Parties referring to the specific priority areas and frequently indicated mitigation options in nationally determined contributions
Of the Parties that communicated new or updated NDCs after the adoption of the Glasgow Climate Pact, the shares that indicated mitigation options were 14–225 per cent higher than the corresponding shares of the 193 Parties in the latest available NDCs. In particular, the shares of those Parties that indicated phasing down unabated coal power generation and phasing out inefficient fossil fuel subsidies and reforming fossil fuel subsidies were more than triple the corresponding shares of the 193 Parties.
Many (50 per cent) Parties considered mitigation co-benefits resulting from their adaptation action and/or economic diversification plans. In their new or updated NDCs more Parties reported on mitigation co-benefits of adaptation action and economic diversification plans, including information on specific projects, measures and activities with the resulting co-benefits, compared with the information in their previous NDCs. Similarly, more Parties provided information on their consideration of social and economic consequences of response measures, and of just transition and/or economic diversification.
Adaptation actions and economic diversification plans with mitigation co-benefits include afforestation and reforestation activities, climate-smart agriculture, reducing food waste, vertical farming, adapting coastal ecosystems, conservation plans for protected areas, nature-based solutions, increasing the share of renewable sources in energy generation, improving energy efficiency, carbon dioxide capture and storage, fuel switch and fuel price reforms in the transport sector, and moving to circular economy for better waste management.
Credit: UN Climate Change
Synergies between efforts in mitigation priority areas and efforts towards the Sustainable Development Goals identified in nationally determined contributions
An increasing number of Parties (40 per cent) are targeting ocean-based climate action. Some Parties (26 per cent) include an ocean-based climate target, policy or measure. Ocean-related measures reported in the NDCs relate more often to adaptation than to mitigation, there has been an increase in adaptation measures identified related to fisheries and aquaculture and relatively few Parties mentioned offshore renewable energy as a mitigation solution.
Almost all Parties mentioned some or all means of implementation in their NDCs, although the structure and depth of that information varied significantly. While some Parties included a dedicated section on means of implementation or separate sections on finance, technology and/or capacity-building, many mentioned or referred to aspects of means of implementation in other sections of their NDCs.
Many Parties (44 per cent) provided quantitative estimates of financial support needs for NDC implementation. In their new or updated NDCs some Parties provided quantitative estimates of financial support needs, with some (34 per cent) of them providing updated quantitative estimates and others (15 per cent) providing estimates for the first time.
Many Parties (58 per cent) identified certain types of technology that they intend to use for implementing adaptation and mitigation actions, most frequently related to the energy, agriculture, water and waste sectors. Technology needs mentioned by Parties were mainly (42 per cent) of a cross-cutting nature addressing both adaptation and mitigation, followed by those focused on mitigation (33 per cent) or adaptation (25 per cent). Since the previous version of this report, the share of Parties (4 per cent) referring in their NDCs to policy and regulatory measures for promoting low-carbon and climate-resilient technologies towards implementing net zero strategies and decarbonization pathways at the national and sectoral level has grown.
Most Parties (74 per cent) identified capacity-building as a prerequisite for NDC implementation. Capacity-building needs for formulating policy, integrating mitigation and adaptation into sectoral planning processes, accessing finance and providing the information necessary for clarity, transparency and understanding of NDCs were identified. In the new or updated NDCs, compared with in their previous NDCs, more Parties expressed capacity-building needs for adaptation.