Innovative ICT solutions are helping Pacific Island countries prepare for and adapt to sea level rise brought about by climate change. This project provides the fundamental data, skills and tools at-risk communities need to make planning decisions. It trains government decision makers to use online tools and flood maps to understand and mitigate the risks of sea level rise. Using these maps, governments can better understand and communicate climate change risk to local communities and put adaptation plans in place.
Key facts:
- More than 10,000 buildings identified at high risk of inundation within 80 years including schools, hospitals and critical infrastructure
- 195 people from the governments of Tonga, Samoa, Vanuatu and Papua New Guinea were trained on how to manage and use LiDAR data
- The Vanuatu Globe was a significant Open Data portal produced for the Vanuatu Government and set a new precedent for publically sharing sea level rise information
- Through the Vanuatu Globe, the project was able to help the 2015 Cyclone Pam recovery by providing critical map information which was accessed by more than 1,000 people a day within days of the cyclone

The problem
The Pacific region includes some of the world’s lowest-lying countries. However, most climate adaptation activities in the Pacific are not informed by the fundamental data required to identify the magnitude of, and communities at risk from, coastal flooding. Adaptation to future sea level rise to build resilience in communities requires a sound understanding of the potential impacts and risks associated with coastal inundation and erosion.

The solution
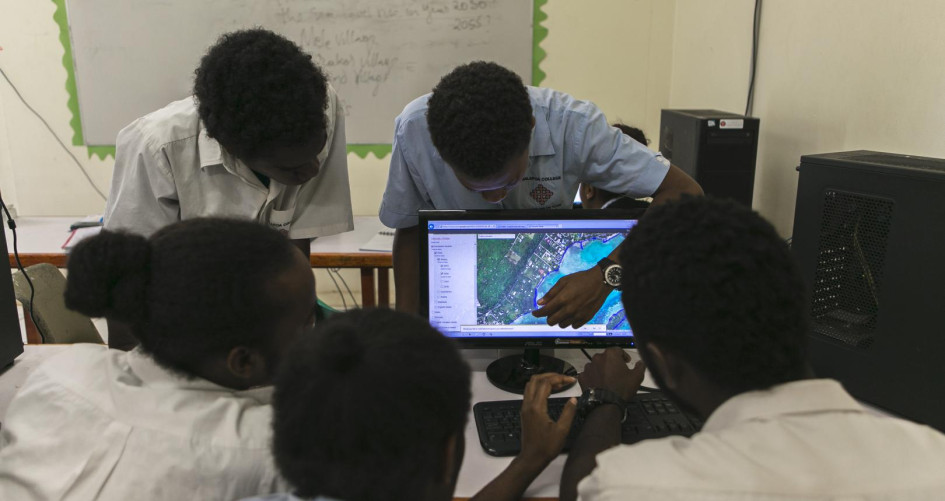
To address the lack of ICT awareness and use by key government decision makers, the project focused on creating intuitive and user friendly applications that would optimize use and availability. The Australian Department of the Environment, the CRC for Spatial Information (CRCSI) and NGIS Australia (NGIS) spent four years working with Tonga, Samoa, Vanuatu and Papua New Guinea, to build capacity in spatial information modeling and decision making through Airborne Light Detection and Ranging (LiDAR) and aerial imagery surveys, geographic information systems (GIS) training and the provision of hardware and software.
The project provided fundamental information, reports and analytics that have enabled the countries to clearly identify the communities most at risk of sea level rise and to then facilitate effective planning and decision making to increase climate change resilience.
Fit for purpose capacity building was delivered for each country with a focus on long-term sustainability. Upgrades to GIS for each government were performed where necessary to ensure the data could be accessed, managed and stored. The hardware and software upgrades ensured a seamless integration with existing non-spatial business systems upon project completion.
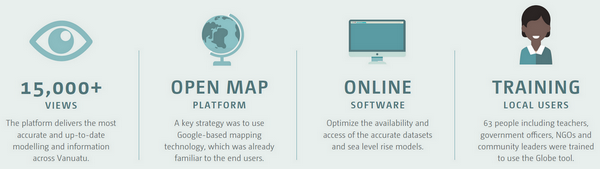
Open platforms were delivered to optimize the availability and access of the accurate datasets and sea level rise models to implement effective community engagement and to maximize the cross-government cooperation with respect to climate change mitigation. Since the delivery of the Vanuatu Globe, the platform has been viewed more than 15,000 times by hundreds of users to deliver the most accurate and up to date modelling and information across Vanuatu. A key strategy was to use Google-based mapping technology, which was already familiar to the end users.
The software and online spatial information tools delivered as part of this project enabled maps to be presented to local communities, informing them of the potential risk. Empowered with these maps, it is now possible for partner governments to understand and communicate the climate change risk to local communities.
Through the provision of current, accurate foundation information and coastal risk assessments the governments of Tonga, Vanuatu, Samoa and Papua New Guinea have been able to include predicted climate change impacts in planning and policy decisions.

Helping people
A comprehensive capacity building and training program was implemented for 195 participants across 95 organizations and four countries, with a focus on supporting the management and use of LiDAR data in a GIS environment.
The LiDAR data has significantly improved the accuracy of sea level rise modeling in these countries and the ability to understand current and future risk to infrastructure and communities.
The LiDAR data is being used to monitor shoreline change, beach erosion and accretion, and vegetation changes. This elevation data is critical to calculating drainage, catchment boundaries, water flow and water sinks. It is also valuable for many other uses including infrastructure planning, evacuation planning and natural resource management.
The governments of Tonga, Vanuatu, Samoa and Papua New Guinea have been able to include predicted climate change impacts in planning and policy decisions. These governments are now implementing a range of measures to mitigate the impacts of storm surge and inundation including sea walls and mangroves. For example, design specifications for a proposed bridge were modified based on the accurate positioning of modeled inundation for predicted sea level rise. Data was also used for other projects. For example, the World Bank is now using the data for its tsunami modeling.
One of the most significant results from this project was the community acceptance and understanding and uptake of the training and solutions. A direct result of the Pacific Islands project was the concept of the Vanuatu Globe, a visualisation tool based on the Google Earth platform developed by NGIS and the CRCSI. Training and education has enabled a widespread use of the data and the Google Earth solution, which has provided the people of Vanuatu with valuable tools for the planning of emergency response and protection against storm surge.
Spillover effect
To make the project more replicable the CRCSI and NGIS designed and developed the Coastal Risk Dashboard. The dashboard provides a platform that automates the generation and availability of both the communication platform and key knowledge products. The Coastal Risk Dashboard greatly reduces costs by providing a fit-for-purpose, flexible product for analyzing and presenting coastal risk and exposure. For example a user can map the number of building, land area and roads affected by different climate change inundation scenarios. Thereby, putting this information and analysis directly in the hands of the decision maker for adaptation outcomes.


Images owned by the activity partners, all rights reserved.