CHAPTER
2 : NATIONAL INVENTORY OF GREENHOUSE GASES
SUMMARY
In accordance with Article 4.1 a of the
United Nations Framework Convention on Climate Change, all parties to the
Convention are requested to update and report periodically on their national
inventory of anthropogenic emissions and removals of greenhouse gases.
There is no primary fuel production in
the Republic of Mauritius. Since all fuels are imported, the Republic is
fully dependent on market vacillation and price fluctuation. Secondary
fuel is imported for local consumption. Except for international marine
and air bunkering, fossil fuel is not exported.
Greenhouse gas emissions and removals by
sinks have been calculated for the year 1995, using the 1996 Intergovernmental
Panel on Climate Change IPCC guidelines for the Preparation of National
Communications, inclusive of all the six identified items.
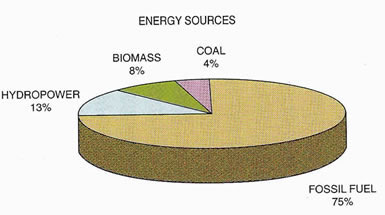 Energy-related
activities are the most significant contributors of greenhouse gases. Energy is
produced mostly through the combustion of fossil fuels such as petroleum, natural
gas and coal, which accounts for 90% of the total with the remaining 10% from
hydropower and biomass.
Energy-related
activities are the most significant contributors of greenhouse gases. Energy is
produced mostly through the combustion of fossil fuels such as petroleum, natural
gas and coal, which accounts for 90% of the total with the remaining 10% from
hydropower and biomass.
Carbon Dioxide CO2 emissions 1995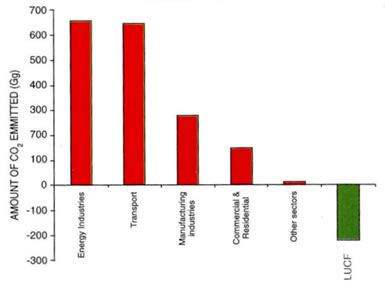
Carbon dioxide is produced from a variety of fossil
fuels used for activities such as public electricity production, transport,
manufacturing industries, commercial and residential buildings. Industrial
processes, agriculture, forestry and fisheries contribute insignificantly.
Other gases like methane, nitrogen dioxide, nitrous
oxides, carbon monoxide, non-methane volatile organic compounds and sulphur
dioxide accounted for about 5% of the total greenhouse gas emission.
|
Non CO2 Emissions Gg
|
|
GAS
|
CH4
|
N20
|
NOX
|
CO
|
NMVOC
|
SO2
|
|
AMOUNT
|
4.600
|
0.727
|
10.180
|
67.003
|
15.481
|
13.369
|
INTRODUCTION
Climate Systems and Radiative
Forces
Solar energy is the main source of power
that drives the climate systems of the earth. About 70% of the short wave
solar radiation is absorbed by the earths surface, oceans, ice caps and
the lower atmosphere known as the troposphere. The rest is re-radiated
into space. The absorbed short wave solar radiation is reflected back into
the atmosphere in the form of out-going long wave infrared radiation. Some
atmospheric gases, existing naturally in the atmosphere and known as greenhouse
gases GHGs, can absorb or "trap" the outgoing long wave radiation emitted
from the earth and re-radiate it back to the earth, thus keeping the earth
and its atmosphere warmer than it should have been. In the long-term a
balance is reached between the absorbed short wave solar radiation and
the outgoing long-wave terrestrial radiation. The climatic and radiative
balance, restored through this mechanism, resulted in a higher temperature
on the earths surface thus permitting life to exist on the planet. Without
the presence of these greenhouse gases, planet Earth would have been uninhabitable.
Greenhouse
Gases
The naturally existing greenhouse gases
are:
-
water vapour H20
-
carbon dioxide C02
-
methane CH4
-
nitrous oxide N20
-
ozone 03
Man-made compounds such as chlorofluorocarbons
CFCs, their substitute hydrofluorocarbons HFCs, and perfluorinated
carbon PFCs also act as greenhouse gases. Other gases such as carbon
monoxide C0, oxides of nitrogen N0X and non-methane volatile
organic compounds NMVOC, contribute indirectly to the greenhouse effect.
Sulphur dioxide S02 also contributes negatively to the greenhouse
effect. Concentrations of these greenhouse gases are going up significantly
in the atmosphere since the industrial revolution era, due to human activities.
The massive injections of these GHGs in the atmosphere may upset the radiative
balance of the atmosphere and could have severe impacts on climate systems,
resulting in global warming and sea level rise.
INVENTORY
PROCESS
Methodology
and Data
The emission estimates, presented in this
initial communication, were calculated according to the 1996 IPCC Revised
Guidelines for National Inventory of Greenhouse Gas, to ensure that the
emission inventory is consistent and comparable across sectors and between
Parties. A copy, of the IPCC guideline worksheets and reporting tables,
is appended in the annexes. The IPCC guidelines have been followed to the
letter and all default values provided have been used.
Both the top-down and bottom-up approaches
have been used for the preparation of this national inventory of greenhouse
gases.
Sources of
data
The data for energy production and consumption
activities are based on the latest information and were obtained from the
following sources:
-
Energy balance for base year 1995
-
Baseline scenario 1995-2020
-
Central Statistical Office
-
State Trading Corporation
-
Central Electricity Board
-
Bulk Bitumen Company Ltd
-
Mauritius Marine Authority
-
Mauritius Sugar Authority
-
Ministry of Agriculture, Fisheries &
Co-operatives - Forestry Department
Data, for a particular item, were obtained
from two or more sources at times. Discussions were held among concerned
parties to arrive at the most viable and reliable information.
Organization
The National Inventory has been organised
into six parts corresponding to the six major source categories, as described
in the IPPC 1996 Guidelines.
I. Energy Activities
A. Fuel Combustion Activities
-
Energy Industries
-
Transport
-
Manufacturing Industries and Construction
-
Other Sectors
-
Other
B. Fugitive Emissions
C. Memo Items
II. Industrial Processes
III. Solvent and other Product Use
IV. Agriculture
-
Enteric fermentation
-
Manure management
-
Agricultural Soils
V. Land Use Change and Forestry
-
Managed lands
-
Grassland Conversion
-
Managed Forests and
-
Clearing Forests
Vl. Waste
-
Solid waste disposal on land
-
Waste water handling
Uncertainty
and limitation of emission estimates
The uncertainties and limitations, as per
IPCC guidelines, will be reflected in this chapter.
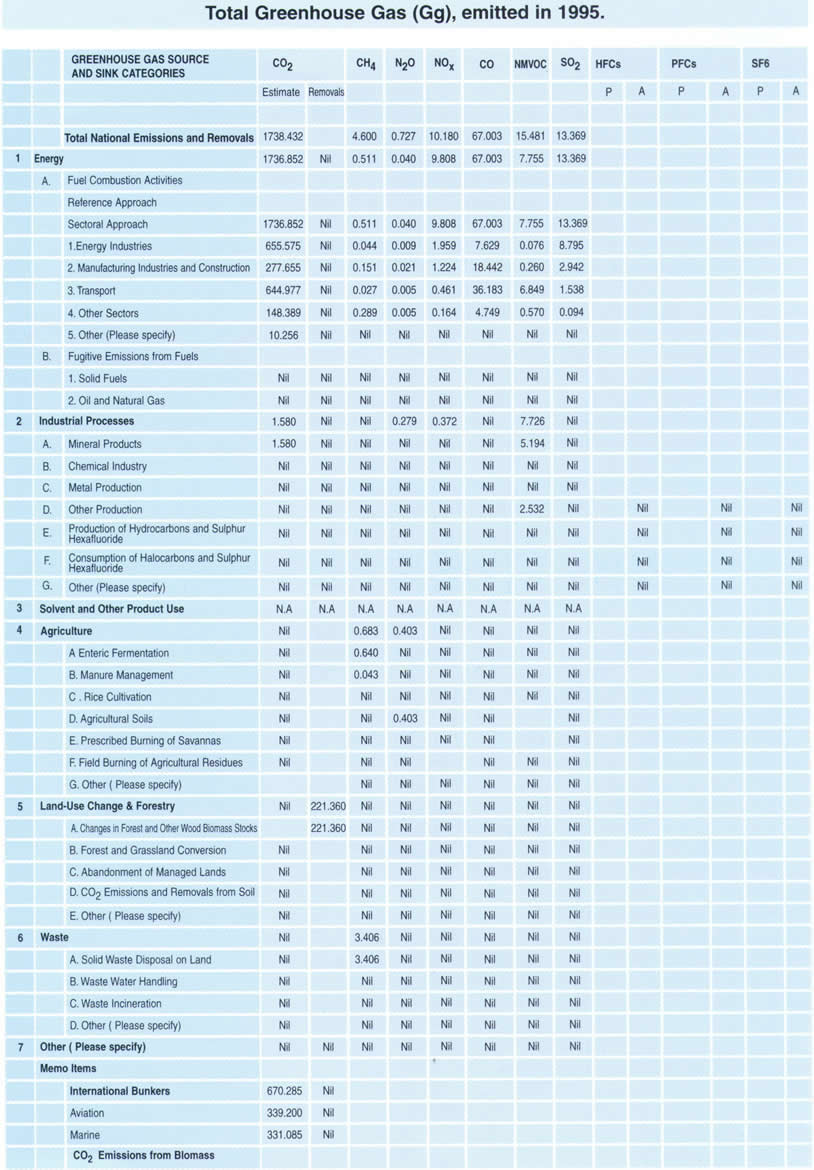
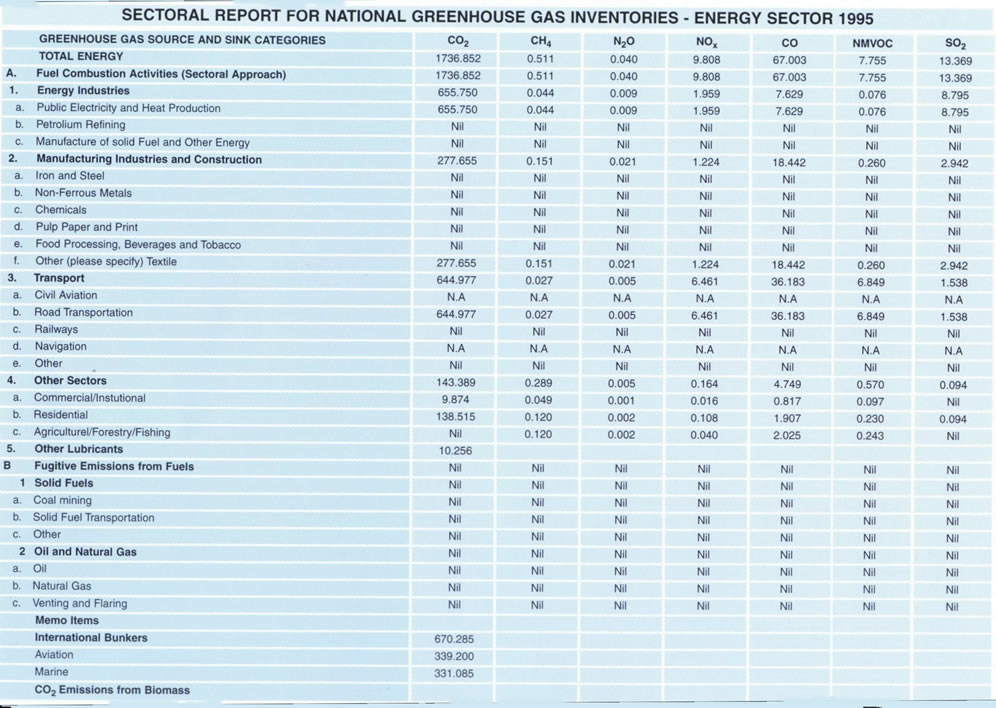
EMISSIONS
Energy
GHG emissions were mainly from two fossil
fuel types: liquid and solid fuel categories. Liquid fossil fuels consisted
of gasoline, jet kerosene and other kerosene, gas/diesel oil, liquefied
petroleum products Lpg and lubricants. Coking coal was the most commonly
used solid fossil fuel.
The total amount of GHG emissions for the
energy sector was 1835.338 Gg, out of which 1736.852 Gg is directly from
C02 emissions. C02 emissions, from fossil fuel, represented
99.9% of total emissions of carbon dioxide and 94% of all greenhouse gas
emissions.
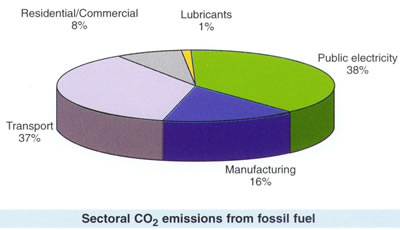
Public Electricity
The Republic relied heavily on fossil fuel for the
production of electricity since other sources were limited. The resulting
C02 emission from this activity totalled 655.575 Gg, representing
38% of total C02 emissions.
Transport
Road transport is the only available means to cater
for passenger and freight displacement. The transport sector consumed 86
536 t of gasoline and 119 287 t of diesel, thus producing of C02
emissions of 644.977 Gg which represented 37% of total C02 emissions.
Manufacturing and Construction
Industries
The major industries, in the Republic of Mauritius,
comprised the following:
-
Sugar
-
Textile
-
Tobacco
-
Stone crushing and block-making and
-
Beverages and allied industries
In the sugar industry, bagasse is the main source of
energy and any excess electricity produced is fed into the national power
grid. Fossil fuels are mainly used for the production of steam and heat
in the textile industry. Lpgis also used in relation to the spinning process.
Electricity is the main source of energy for driving motors, lighting and
air conditioning. CO2 emissions from this sector accounted for
about 16% of the total emissions and were estimated at 277.655 Gg.
Residential / Commercial
Sectors
Energy needs in the residential/commercial
sectors were met mainly from the following sources:
-
Kerosene
-
Lpg
-
Charcoals
-
Fuel wood and
-
Electricity
Both the residential and commercial sectors
relied heavily on electricity for lighting and air conditioning purposes.
Cooking needs were satisfied mainly from Lpg. The need for fuel wood and
charcoals exerts pressure on the already reduced natural forest reserves
- less than 3% of the total area.
In 1986 the Government promoted the use
of Lpg, as an alternate source of energy, by reducing up to 50% customs
duty on its import. All appliances, using Lpg, were exempted from all taxes.
A sharp increase in Lpgconsumption was noted and reached 30 174 tons in
1995. This trend is being maintained and future Government policy is to
phase out completely the use of kerosene, fuel wood and charcoal.
CO2 emissions from these two
sectors were estimated to be 148.389 Gg and represented 9% of the total
emissions.
Sectoral CO2 emissions Gg based on Fuel Types
|
Sectors
Fuel type |
Public
Electricity
|
Transport
|
Manufacturing/
Constructing Industries
|
Residential/
Commercial
Sectors
|
Residual
Fuel Oil |
412.339
|
-
|
-
|
-
|
| Gas/Diesel Oil |
9.805
|
379.001
|
115.016
|
-
|
| Gasoline |
-
|
265.976
|
65.091
|
-
|
| Other Kerosene |
150.722
|
-
|
-
|
49.386
|
| Coking Coal |
82.709
|
-
|
-
|
-
|
| Cooking Coal |
-
|
-
|
89.555
|
-
|
| Lpg |
-
|
-
|
7.993
|
99.003
|
Non-CO2 emissions
from fossil fuel combustion
 Apart
from CO2 emissions, fossil fuel combustion produces other greenhouse
gases, such as methane and nitrous oxide, and also the photochemically important
gases such as oxides of nitrogen, carbon monoxide and non-methane volatile organic
compound, which are all products resulting from incomplete combustion. Amounts
of these non-CO2 emissions vary depending on types of fuel and technology
used, and existing pollution control practices.
Apart
from CO2 emissions, fossil fuel combustion produces other greenhouse
gases, such as methane and nitrous oxide, and also the photochemically important
gases such as oxides of nitrogen, carbon monoxide and non-methane volatile organic
compound, which are all products resulting from incomplete combustion. Amounts
of these non-CO2 emissions vary depending on types of fuel and technology
used, and existing pollution control practices.
Sulphur Dioxide Emissions
from fossil fuel combustion
Varying proportions of sulphur are found in fossil
fuels and during their combustion sulphur dioxide, which acts negatively
on the greenhouse effect, is emitted. The amount of SO2 emissions
depends on the sulphur content of the fuel, the sulphur retention in the
ash, the abatement efficiency and other factors. Local figures provided
by competent authorities for sulphur content of all imported fossil fuels
have been taken into consideration in the calculations together with default
values provided by IPCC.
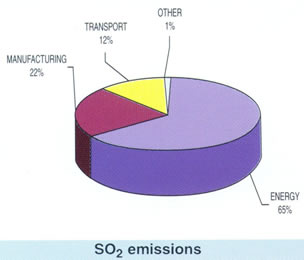 SO2
emissions in 1995 were estimated at 13.369 Gg and details are presented in the
summary table. Electricity production accounted for more than 66% of total SO2
emission.
SO2
emissions in 1995 were estimated at 13.369 Gg and details are presented in the
summary table. Electricity production accounted for more than 66% of total SO2
emission.
Carbon stores in products
Bitumen and lubricants have been imported in l995
for non-energy application sectors such as road construction. The carbon
stored has been estimated at 17.184 Gg.
|
Product
|
Carbon stored Gg
|
|
Lubricants
|
2.833
|
|
Bitumen
|
14.351
|
|
Total
|
17.184
|
Fugitive Emissions
Coal mining, handling, production, processing, transport
and use of oil and natural gas as well as the non-productive combustion
and conversion of crude petroleum into a variety of sub-products are associated
with fugitive emissions are not carried out in Mauritius. Therefore fugitive
emissions from fuels are nil.
Memo items
International bunkers
International bunkering accounted for 670.285 Gg
of CO2 emission in 1995 and the details are given in the table
below.
|
Fuel type
|
CO2 emission Gg
|
|
Jet Kerosene
|
339.200
|
|
Gas Diesel Oil
|
270.237
|
|
Residual Fuel oil
|
60.848
|
|
Total
|
670.285
|
.
INDUSTRIAL
PROCESSES
Greenhouse gases are also produced, as residues of
various non-energy related activities. These gases are emitted directly
from the process itself, not as a result of energy consumption during the
process.
The production processes, of interest to the Republic
of Mauritius, are:
· Lime
production
· Asphalt,
used for tarring roads
· Nitric
Acid production and
· Food
and Beverages
The above-mentioned activities are carried
out on a very small scale and contribute to the following emissions.
|
GHGs
|
Amount Gg
|
|
Carbon Dioxide
|
1.580
|
|
Nitrous Oxide
|
0.279
|
|
Oxides of Nitrogen
|
0.372
|
|
NMVOC
|
7.726
|
SOLVENT AND OTHER PRODUCT USE
Solvent and other chemical products can produce emission
of some greenhouse and photochemically important trace gases. Emission
from this sector has not been calculated due to lack of sufficient data.
AGRICULTURE
The Republic of Mauritius depends almost entirely
on imports for its main basic foodstuffs, except for vegetables. It has
a very small livestock population. There is no cultivation of rice, no
prescribed burning of savannas or field burning of agricultural residues.
Mauritius is concerned with only enteric fermentation, manure management
and agricultural soils on a very small scale only. Emissions from animal
production and from animal waste management system are negligible.
The resulting methane emissions is summarised below:
|
Livestock type
|
Population
|
Enteric Fermentation
|
Manure Management
|
CH4 emission Gg
|
| Dairy cattle |
8500
|
306.00
|
8.50
|
0.314
|
| Non Dairy cattle |
8000
|
256.00
|
8.00
|
0.264
|
| Sheep |
1500
|
7.50
|
0.31
|
0.007
|
| Goats |
10000
|
50.00
|
2.20
|
0.052
|
| Horses |
500
|
9.00
|
1.10
|
0.010
|
| Mules & Asses |
25
|
0.25
|
-
|
-
|
| Swine |
12000
|
12.00
|
24.00
|
0.036
|
| TOTAL |
|
640.75
|
44.11
|
0.683
|
Agricultural
Soils
Nitrous oxide can be produced from agricultural
soils through various activities such as application of synthetic fertilizer,
animal waste, nitrogen-fixing crops, crop residues and through indirect
emissions from the atmospheric deposition. The N20 emissions
from these activities have been estimated at 0.403 Gg. There is no N20
emission from the cultivation of histosols.
LAND
USE CHANGE AND FORESTRY
A wide variety of carbon and nitrogen trace
gases are either emitted or absorbed in the biosphere. Any changes in the
biosphere, through land use changes and forestry activities will modify
the natural balance of these trace gases both in emissions and uptake.
On the global scale the human activity which most affects the biosphere
is deforestation, especially in the tropical region.
In this sector, the calculation of emissions
focuses on four activities which act either as sources or sinks:
-
abandoning of managed lands
-
grassland conversion
-
managed forests
-
clearing forests
Abandoning
of Managed lands
Since land area in Mauritius is very limited,
intensive agriculture is practiced on all suitable land and there is no
abandoning of managed lands.
Grassland conversion
Under this item it is required to estimate
the net CO2 emissions resulting from the conversion of grasslands
into cultivated lands during the last 25 years up to the inventory year.
Grassland conversion has been negligible, in the Republic, as there has
been practically no grassland, which has been converted to cultivated land.
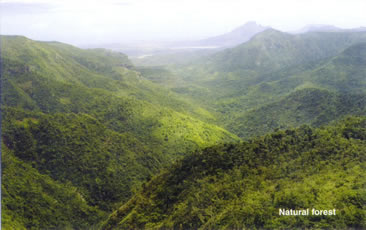
Managed forests
Forests are critical components of the
climate system. Their potential for sequestering greenhouse gases is enormous,
and they act as an additional "reservoir" for CO2 emissions.
Prior to the 16th century, the whole island of Mauritius was
covered with dense forests, mainly of tall, slow-growing trees. Unfortunately
in the late 18th and early 19th century, most primary
forests were cut down as land was converted for agricultural purposes.
Forests were cut for timber to build boats and houses, for fuel wood and
particularly to clear land for cane cultivation. Today less than 1% of
the area of Mauritius is under some sort of native vegetation.
In the National Inventory assessment survey
for Mauritius, the CO2 uptake from changes in forests and other
woody biomass stocks was analyzed and the results presented in the table
below.
| Carbon
Uptake by Forests |
| Plantations |
Area
kha
|
Annual
Growth Rate
tdm/ha
|
Annual
Biomass
Increment ktdm
|
Carbon
Fraction
of
Dry Matter
|
Total
Carbon Uptake
Increment
ktc
|
| Conifers |
12.55
|
5.25
|
65.924
|
0.45
|
29.666
|
| Casuarina |
0.65
|
6.30
|
4.095
|
0.45
|
1.843
|
| Nature
Reserves |
9.20
|
1.30
|
11.960
|
0.45
|
5.382
|
| Exotic
Scrubs |
34.54
|
2.60
|
89.804
|
0.45
|
40.412
|
| Total |
56.94
|
|
|
|
77.303
|
Non Forest Trees Conifers
Number of trees = 600,000
Annual growth Rate = 2.916 x 10³
kt dm
Annual Biomass increment = 600 x 2.916
x 103 = 1.749 ktdm
Carbon Fraction of Dry Matter = 0.45
Carbon uptake Increment = 1.749 x 0.45
= 0.787 ktc
Carbon Uptake
Total Carbon uptake Increment = 77.303
+ 0.787 = 78.090 ktc
The annual biomass carbon removal is 17.749
ktc/yr
Thus the net CO2 flux is 221.36
Gg
Forest clearing
The conversion of forests to permanent
cropland or pasture is insignificant in Mauritius since the land area is
small and limited. There is no remaining forestland that could be converted
to cropland.
WASTE
Methane is one of the principal sources
of greenhouse gases contributing to global warming, second only to carbon
dioxide. Methane emissions originate from several sources including anaerobic
decomposition of organic wastes in solid waste disposal sites, in sludge
and residual solid by-products. In this sector, methane emission is calculated
from solid waste disposal sites and from domestic and industrial waste
water handling.
Solid waste
disposal site on land
Anaerobic decomposition of organic matter
in solid waste disposal sites by methanogenic bacteria results in methane
emissions. The method used to calculate methane emission depends on the
amount of waste disposed, the fraction of degradable organic carbon, the
amount, which actually degrades, and the fraction of methane in landfill
gas. It is also assumed that methane is released in the same year that
the waste is placed in the disposal site.
There is no sanitary landfill at present
in Mauritius. Solid wastes are disposed of in about ten open disposal sites.
No accurate data on the quantity of waste collected is available. In 1993,
Scott Wilson Kirkpatrick, a consulting firm which prepared the "National
Solid Waste Management Plan", estimated that the domestic waste produced
per head is 0.6 kg per day. Since there has been a lot of waste burning
in the open disposal sites, it is estimated that only 20% of the domestic
waste disposed of, could be considered to be in the landfill sites. The
calculations IPCC worksheet 6-1 have shown that the net methane emission
from domestic solid waste disposal is 3.406 Gg.
Domestic waste
water handling
Domestic waste water includes all liquid
wastes from factories, hotels, restaurants and residential premises. Only
parts of two urban districts of Port Louis and Plaines Wilhems have sewage
facilities, representing only 20% of the population. At present all our
waste water treatment works comprise of preliminary treatment, that is
screening, removal of grit and disintegration of solids and then the effluents
are disposed of through sea outfalls. There is no anaerobic treatment of
sewerage and so no production of sewage sludge. The remaining 80% of the
population use septic tanks and on-site disposal systems.
Hence, no estimates of methane emissions
from domestic waste water have been made.
Industrial
Waste Water
 Agro-industries
and dye houses essentially produce the industrial waste water, and they
are largely untreated. Many factories discharge their waste water into
the subsoil. The sugar factories use their effluent for irrigation. In
some cases, effluent is treated prior to disposal but most treatment plants
provide for biological treatment by an oxidation process and a correction
of pH. There is no anaerobic treatment of effluent. Thus, estimation of
methane emission from industrial waste water has not been carried out.
Agro-industries
and dye houses essentially produce the industrial waste water, and they
are largely untreated. Many factories discharge their waste water into
the subsoil. The sugar factories use their effluent for irrigation. In
some cases, effluent is treated prior to disposal but most treatment plants
provide for biological treatment by an oxidation process and a correction
of pH. There is no anaerobic treatment of effluent. Thus, estimation of
methane emission from industrial waste water has not been carried out.
CONCLUSION
Any adaptive or mitigation measure to be
taken for the Republic of Mauritius, will have to be in the field of either
electricity production or transportation. Increase in energy-efficient
use of equipment in the manufacturing sectors will not only cut down cost
of production but will also contribute to a decrease in GHG emission.
ANNEXES