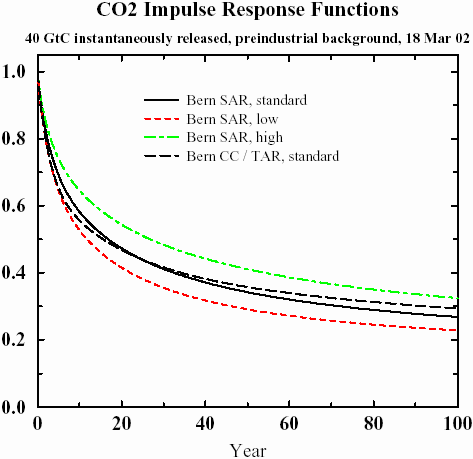
The CO2 concentration is approximated by a sum of exponentially decaying functions, one for each fraction of the additional concentrations, which should reflect the time scales of different sinks. The coefficients are based on the pulse response of the additional concentration of CO2 taken from the Bern model (Siegenthaler and Joos, 1992).
 f
f
|
||
r |
= |
concentration |
CCO2 |
= |
constant (approximately 0.47 ppmv/GtC, but use this parameter to fine tune your results) |
ECO2 |
= |
emissions of CO2 |
tCO2,S |
= |
atmospheric exponential decay time of the sth fraction |
fCO2,0 |
= |
first fraction (0.152) |
fCO2,S |
= |
respective fractions (0.253, 0.279 and 0.316) |
Check how closely CO2 concentrations modelled using the CDIAC emissions approach observed CO2 concentrations. If the agreement is poor, use CCO2 to tune the results.
The values for fCO2,S and t CO2,S given above are the Bern TAR standard and should be used as the default. Alternative values for the CO2 impulse response functions, for exploring the uncertainties, are given in the table below.
Reference:
The carbon cycle can be approximated as given in Den Elzen, M. et al., The Brazilian proposal and other options for international burden sharing: an evaluation of methodological and policy aspects using the FAIR model, RIVM Report No. 728001011, June 1999.
18 March 02
F. Joos, University of Bern, 3012 Bern, joos@climate.unibe.ch
The impulse response function (IRF) is then fitted by a series of exponentials:
IRF= a(0) + Sum a(i) * exp(-t/tau(i))
The following coefficients were obtained:
c |
Bern SAR |
Bern TAR |
||
standard |
low |
high |
standard |
|
a(0) |
0.1369 |
0.1253 |
0.1504 |
0.152 |
a(1) |
0.1298 |
0.0989 |
0.1787 |
0.253 |
a(2) |
0.1938 |
0.1839 |
0.1798 |
0.279 |
a(3) |
0.2502 |
0.2674 |
0.2201 |
0.316 |
a(4) |
0.2086 |
0.2380 |
0.1725 |
- |
a(5) |
0.0807 |
0.0865 |
0.0975 |
- |
tau(1) |
371.6 |
407.2 |
330.8 |
171.0 |
tau(2) |
55.70 |
50.86 |
67.03 |
18.0 |
tau(3) |
17.01 |
15.19 |
21.72 |
2.57 |
tau(4) |
4.16 |
3.73 |
5.61 |
- |
tau(5) |
1.33 |
1.42 |
1.51 |
- |

This figure is also available as a PDF.
- All IRFs are obtained by running the Bern model (HILDA and 4-box biosphere) as used in SAR or the Bern CC model (HILDA and LPJ-DGVM) as used in the TAR.- A preindustrial background (CO2 around 280 ppm, zero emissions) was used and a pulse of 40 GtC was released instantanteously into the model atmosphere. Control simulations were also performed.
- For the Bern CC/TAR version, the IRF was calculated for the standard model version.
- Three IRFs (standard, low, high) were calculated with the Bern SAR model.
- The CO2-fertilization parameter beta was varied within plausible ranges to obtain a "standard," "low", and "high case". This approach builds on SAR simulation where beta was varied in the same manner.
|
High value corrected May 16th
- The IRFs were fitted by sum of exponentials. The coefficients of these fits and the IRFs obtained by using the exponential approximation are provided.